lncRNA Structure Prediction
Species Name : Withania somnifera Sequence Id : ES897438.1
I. Result for minimum free energy prediction
The optimal secondary structure in dot-bracket notation with a minimum free energy of (-140.20)(-589.20) is given below.
1. Sequence-
GGCGGCACAACGAGAAAGUGGACCCCCGGGCUGCUAUUUAACCCUCGCACGAGGCCACCA
GCCAUGUACGGUAGCAGGAGCCCCUUCCUUAUCCUUACUUCCCCAGAAGCUGCCCCUAUA
GCCAGGCAUUUCAGUGAAUUAUUUUCCCUUAUGGAGGCUAUUGCAUGGAAUGGCCCCUAG
CUUACCAGCAAGCUUAUUACCGAUAGACAUAACAUGCUUUUUAUUGGUGACAACUGAUGU
GAUUGACCCAAUCAAAGUUUCCUUUUUACACUGGCAUUGUAUUAGCACCCCCAACCAUUU
AACGGCACCCCUUAUGUGAUGAUGUUAAGUUCCUAAGUUUUGACUUUUAUCCUGCAUGAC
AUUGCAUUCGCAAAACUGCAGGUUGAUUUCUUGAGUGUUAAGUUGAAUGUGAGUAUUAGG
UGGUUGUGAAAAGUAAUCAUUAGUGUUAACAAAAGACACUAGGUGUUGGCGGGAAUAACU
GGUGACACCCGGGGUAACUUUACUGUUUGAGAAUUUAAUUCUCAGGUUAAUAGCCUCAAAGAUUAAGCCAUGCAUGUCUAAGUAUGAACUAUUUCAGACUGUGAAACUGCGGAUG
GCUCAUUAAAUCAGUUAUAGUUUCUUUGAUGGUACCUUUACUACUCGGAUAACCGUAGUA
AUUCUAGAGCUAAUACGUGCACAAAAUCCCGACUCUUGGAAGGGACGCAUUUAUUAGAUA
AAAGGCCGGCGCGGGCUUGCCCGCUACUCCGGUGAUUCAUGAUAACUCGACGGAUCGCAC
GGCCUUUGUGCUGGCGACGCUUCAUUCAAAUUUCUGCCCUAUCAACUUUCGAUGGUAGGA
UAGAGGCCUACCAUGGUGGUGACGGGUGACGGAGAAUUAGGGUUCGAUUCCGGAGAGGGA
GCCUGAGAAACGGCUACCACAUCCAAGGAAGGCAGCAGGCGCGCAAAUUACCCAAUCCUG
ACACGGGGAGGUAGUGACAAUAAAUAACAAUACUGGGCUCAUCGAGUCUGGUAAUUGGAA
UGAGUACAAUCUAAAUCCCUUAACGAGGAUCCAUUGGAGGGCAAGUCUGGUGCCAGCAGC
CGCGGUAAUUCCAGCUCCAAUAGCGUAUAUUUAAGUUGUUGCAGUUAAAAAGCUCGUAGU
UGGAUCUUGGGUCGUCACGGUUGGUCUGCCUACUCGGUGUGCACUGGCCCUCACGUCCCU
UCUGCCGGCGGCGUGCUCCUGGCCUUAAUUGUCUGGGUCGCGGUUCCGGCGCCGUUACUU
UGAAAAAAUUAGAGUGCUCAAAGCAAGCCUACGCUCUGAAUACAUUAGCAUGGAAUAACG
UGAUAGGAGUCUGGUCCUGUUCCGUUGGCCUUCGGGACCGGAGUAAUGAUUAAUAGGGAC
UGUCGGGGGCAUUCGUAUUUCAUUGUCAGAGGUGAAAUUCUUGGAUUUACGGAAGACGAA
CCACUGCGAAAGCAUUUGCCAAGGAUGUUUUCAUUAAUCAAGAACGAAAGUUGGGGGCUC
GAAGACGAUCAGAUACCGUCCUAGUCUCAACCAUAAACGAUGCCGACCAGGGAUCGGCGG
AUGUUGCUCUAAGGACUCCGCCAGCACCUUCUGAGAAAUCAGAGUGUUUGGGUUCCGGGG
GGAGUAUGGUCGCAAGGCUGAAACUUAAAGGAAUUGACGGAAGGGCACCACCAGGAGUGG
AGCCUGCGGCUUAAUUUGACUCAACACGGGGAAACUUACCAGGUCCAGACAUAGUAAGGA
UUGACAGAUUGAGAGCUCUUUCUUGAUUCUAUGGGUGGUGGUGCAUGGCCGUUCUUAGUU
GGUGGAGCGAUUUGUCUGGUUAAUUCCGUUAACGAACGAGACCUCAGCCUGCUAACUAGC
UACGCGGAGGUUUCCCUUCGUGGCCAGCUUCUUAGAGGGACUAUGGCCGUUUAGGCCAUG
GAAGUUUGAGGCAAUAACAGGUCUGUGAUGCCCUUAGAUGUUCUGGGCCGCACGCGCGCU
ACACUGAUGCAACCAACGAGUUUUUCUCCCUGGUCCGAAAGGUUCGGGAAAUCUUGCCAA
AUUGCAUCGUGAUGGGGAUAGACCAUUGCAAUUAUUGAUCUUCAACGAGGAAUUCCUAGU
AAGCGCGAGUCAUCAGCUCGCGUUGACUACGUCCCUGCCCUUUGUACACACCGCCCGUCG
CUCCUACCGAUUGAAUGAUCCGGUGAAGUGUUCGGAUCGCGACGACGGCGGUGGUUUCCG
UCGCCGAUGUUGCGAGAAGUUCAUUGAACCUUAUCAUUUAGAGGAAGGAGAAG
2. MFE structure-
((.((....((......))....)))).(((((....((((((.....(((.(((.....))).)))(((((((.((..(((((..........((((..((((.(((((((((..........)))...((((((((.....)))......((.(((((((......))))))))).(((((......)))))..((((
((((((((((...)))...)))))))))))..)))))..((((((...)))))).))))))........(((.(((((...(((((((...(((....(((((.(((....(((((((((((.((((((.........))))))..)))))..))))))..((((....))))...)))..)))))....))).))))))
)....))))).)))....)).))..))))...........(((((((.......)))))))(((((((.(((......))).))))))).)))))..))))))))).(((((((...))))))))))))))))))..........(((((((((..((..(((.((((....)))).)))..))...)))..)))))).........((((.((((..(((((((.(((((((.....((((((..(((.(((.....)))...((((((.((((......((((..((...))..)))).)))).))))))...(((((((((((((((....)
))))...((((..((...........))..))))..)).))))))))(((((((((.((((((............(((((..(((((((((((((((((.......))))))))........((.....))......(((((((((.(((((....((.((((........)))).))..(((((((((.((((.(((((
..((..........(((((.....(((((..(((.........((..(((((((((((((...))))))))).))))..)).........)))..))))).....)))))..........))..))))).))))....(((((((((..(((((((.(((((((..........))))))).((((....))))...)))
))))....(((.(((...(((((((.((((.....))))...)))))))...))).)))...)))).)))))(((((((((((((((...(((....((.(((((((((.(((..((((((((.....)))))))).(((.(((........))).)))...(((....)))....((((.(((((((......))))))
).)))))))..))))))))))).....)))...)))))....)))))))))).....(((((((......))))))))))))))))...)))))..)))))).))).((((((((((.....))))))))))............))))))))))))))..)))).))..........(((((((...((((......(((
(.((.....)).))))......))))..)).)))))..))))))))).((((((....))))))......)))))))))))).)))).)))).))))))).))))....((((((((.((((((((.((((.....))))((((...))))........(((((......((..(((((...((....))...)))))..
))......))))).))))))))))))))))(((((((((((((((.(((......((((((((((.((((...((((.(((.............))).)))).)).))))))))))))(((.((((((((....))))))))...))).......(((((((((((((.....)))))))...(((.(((((((((((((
((((((...((((...........))))(((....)))((((((.(((((((....((((.((((((.(((........)))...)))))).)))).....)))))))))).)))..)))))))..))...)))))).)))).))).(((....)))(((.(((((((((.....))))))))).)))..))))))))).
..))))).))))))))))..(((((.((..(((((((((..(((..((((......((((((((.(((((((((...))))))))).))))))))......))))..)))..))))))))).)).)))))...
You can download the minimum free energy (MFE) structure in
II. Results for thermodynamic ensemble prediction
1. The free energy of the thermodynamic ensemble is [-150.29][-619.77] kcal/mol.
2. The frequency of mfe structure in ensemble 7.75228e-08 frequency of mfe structure in ensemble 2.89406e-22.
3. The ensemble diversity 151.17 ensemble diversity 431.21.
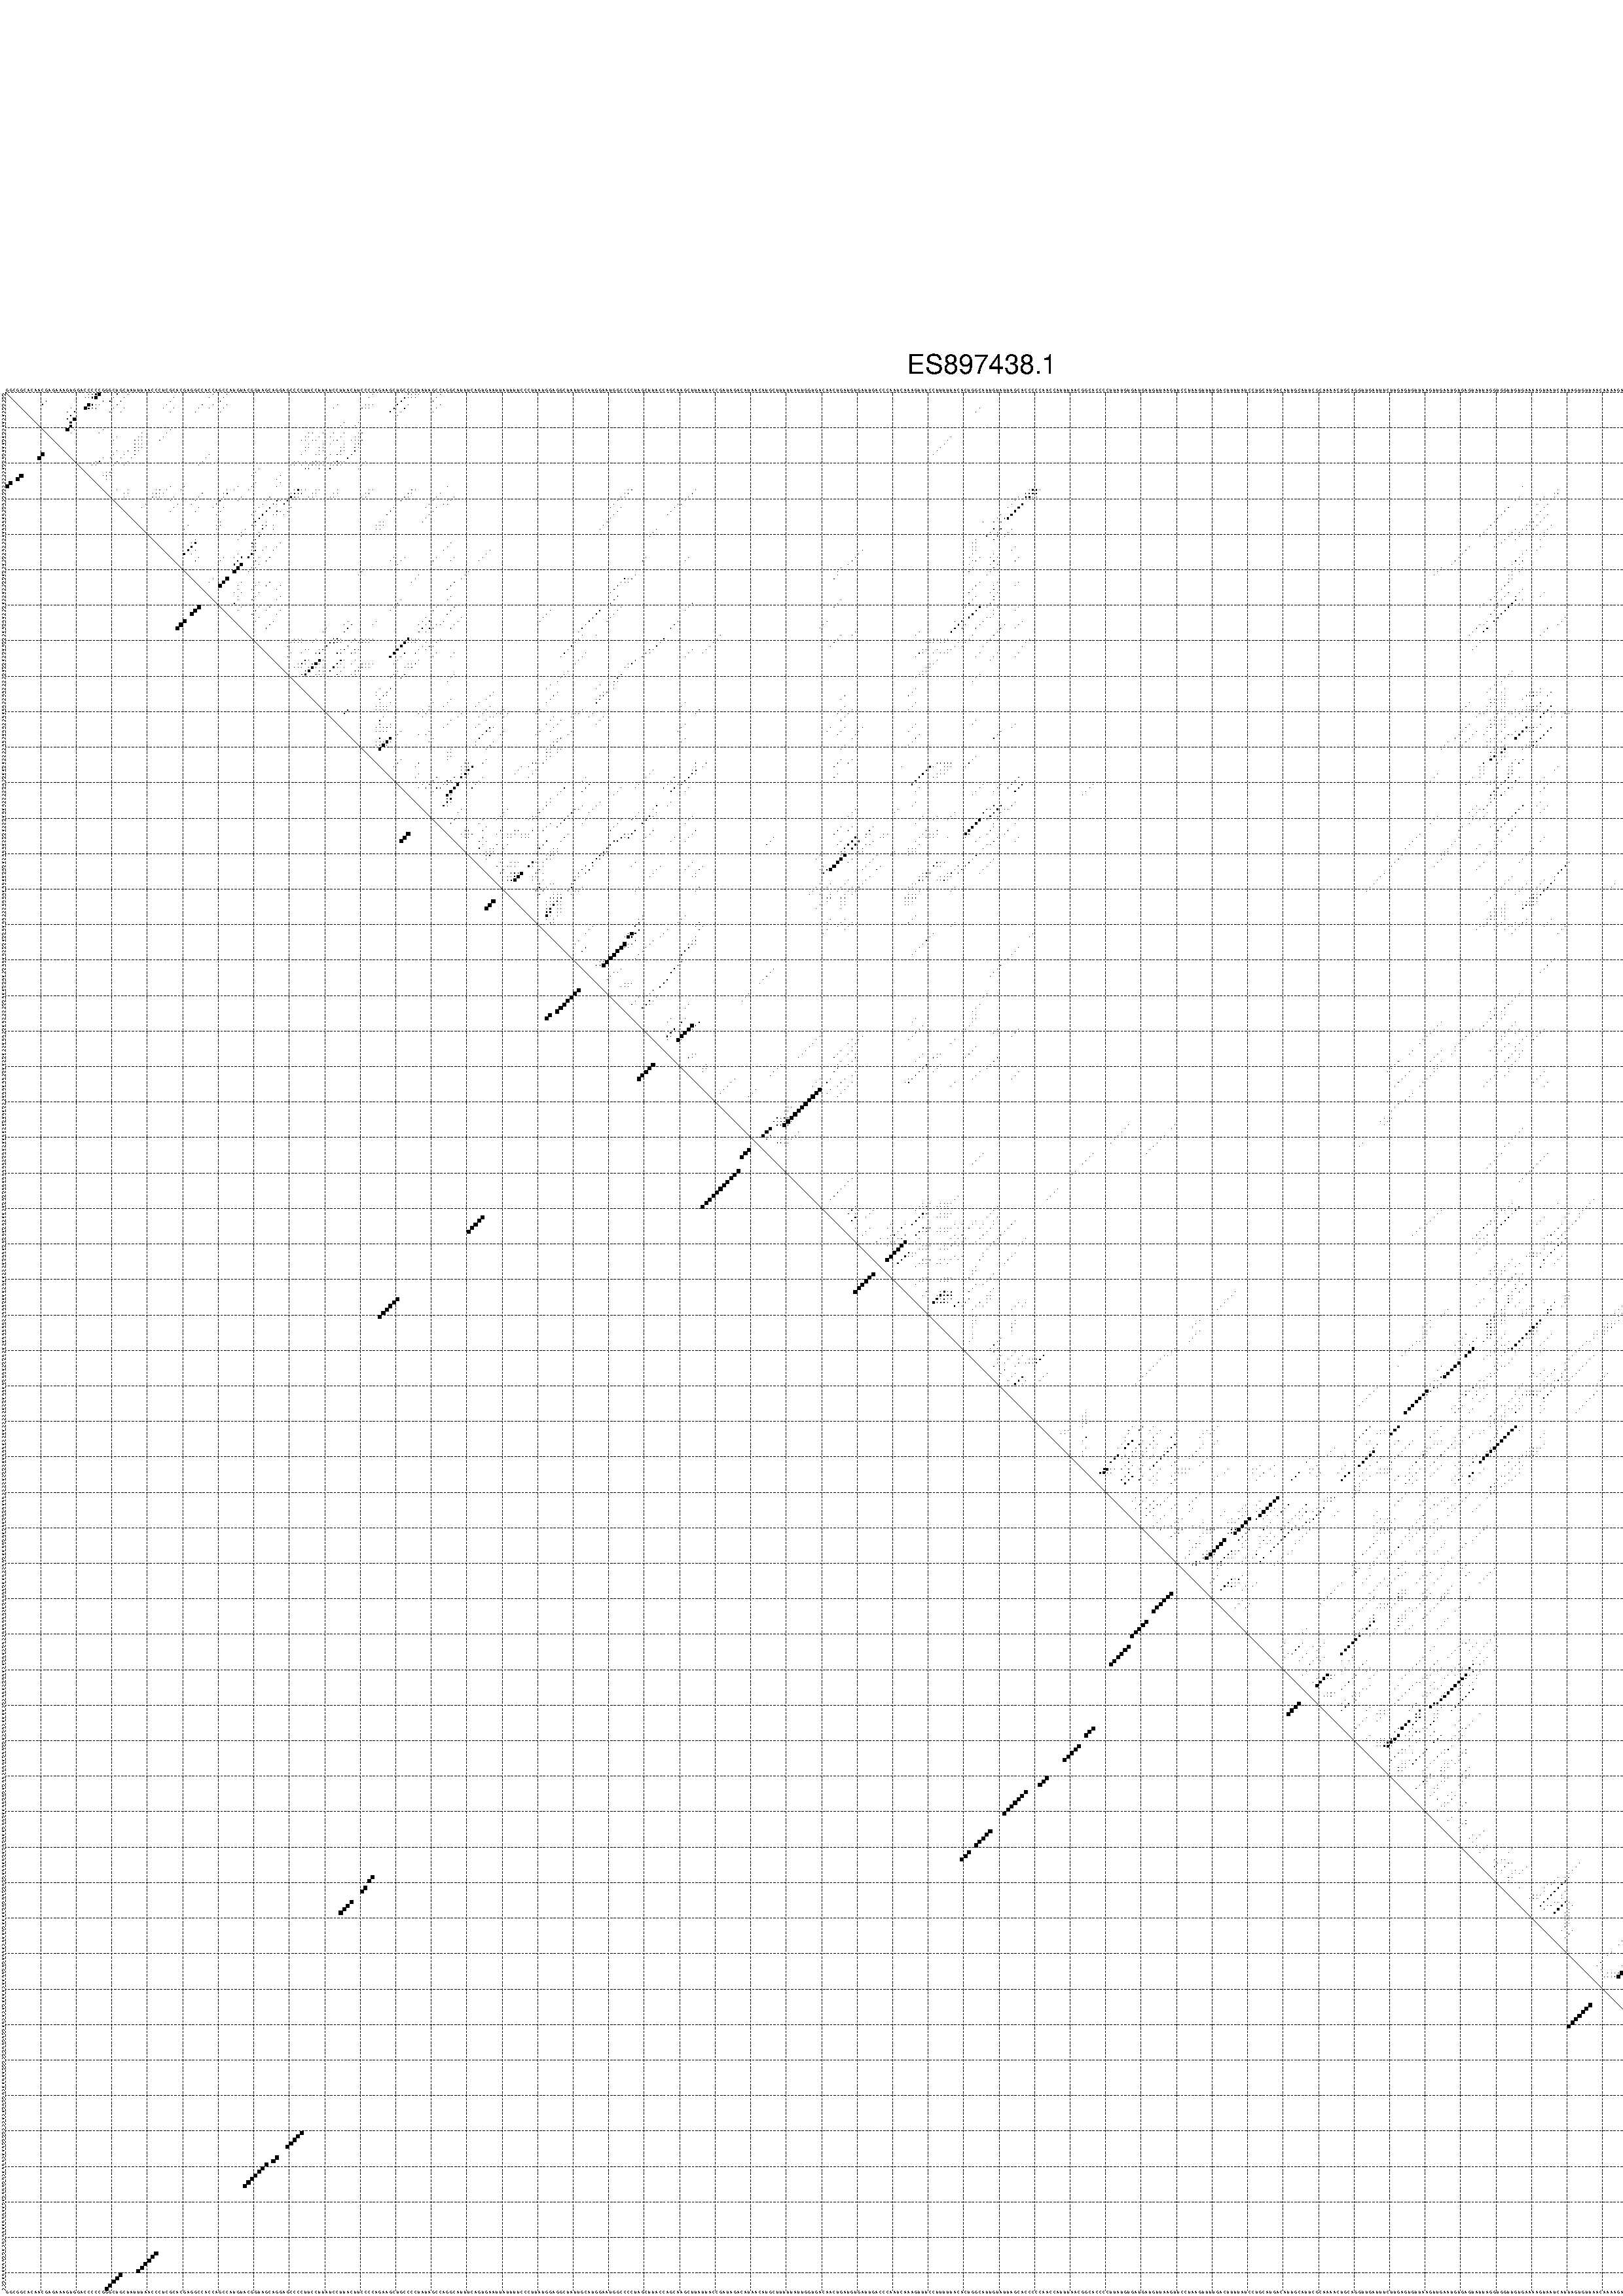
4. You may look at the dot plot containing the base pair probabilities [below]
III. Graphical output
1. A note on base-pairing probabilities:--
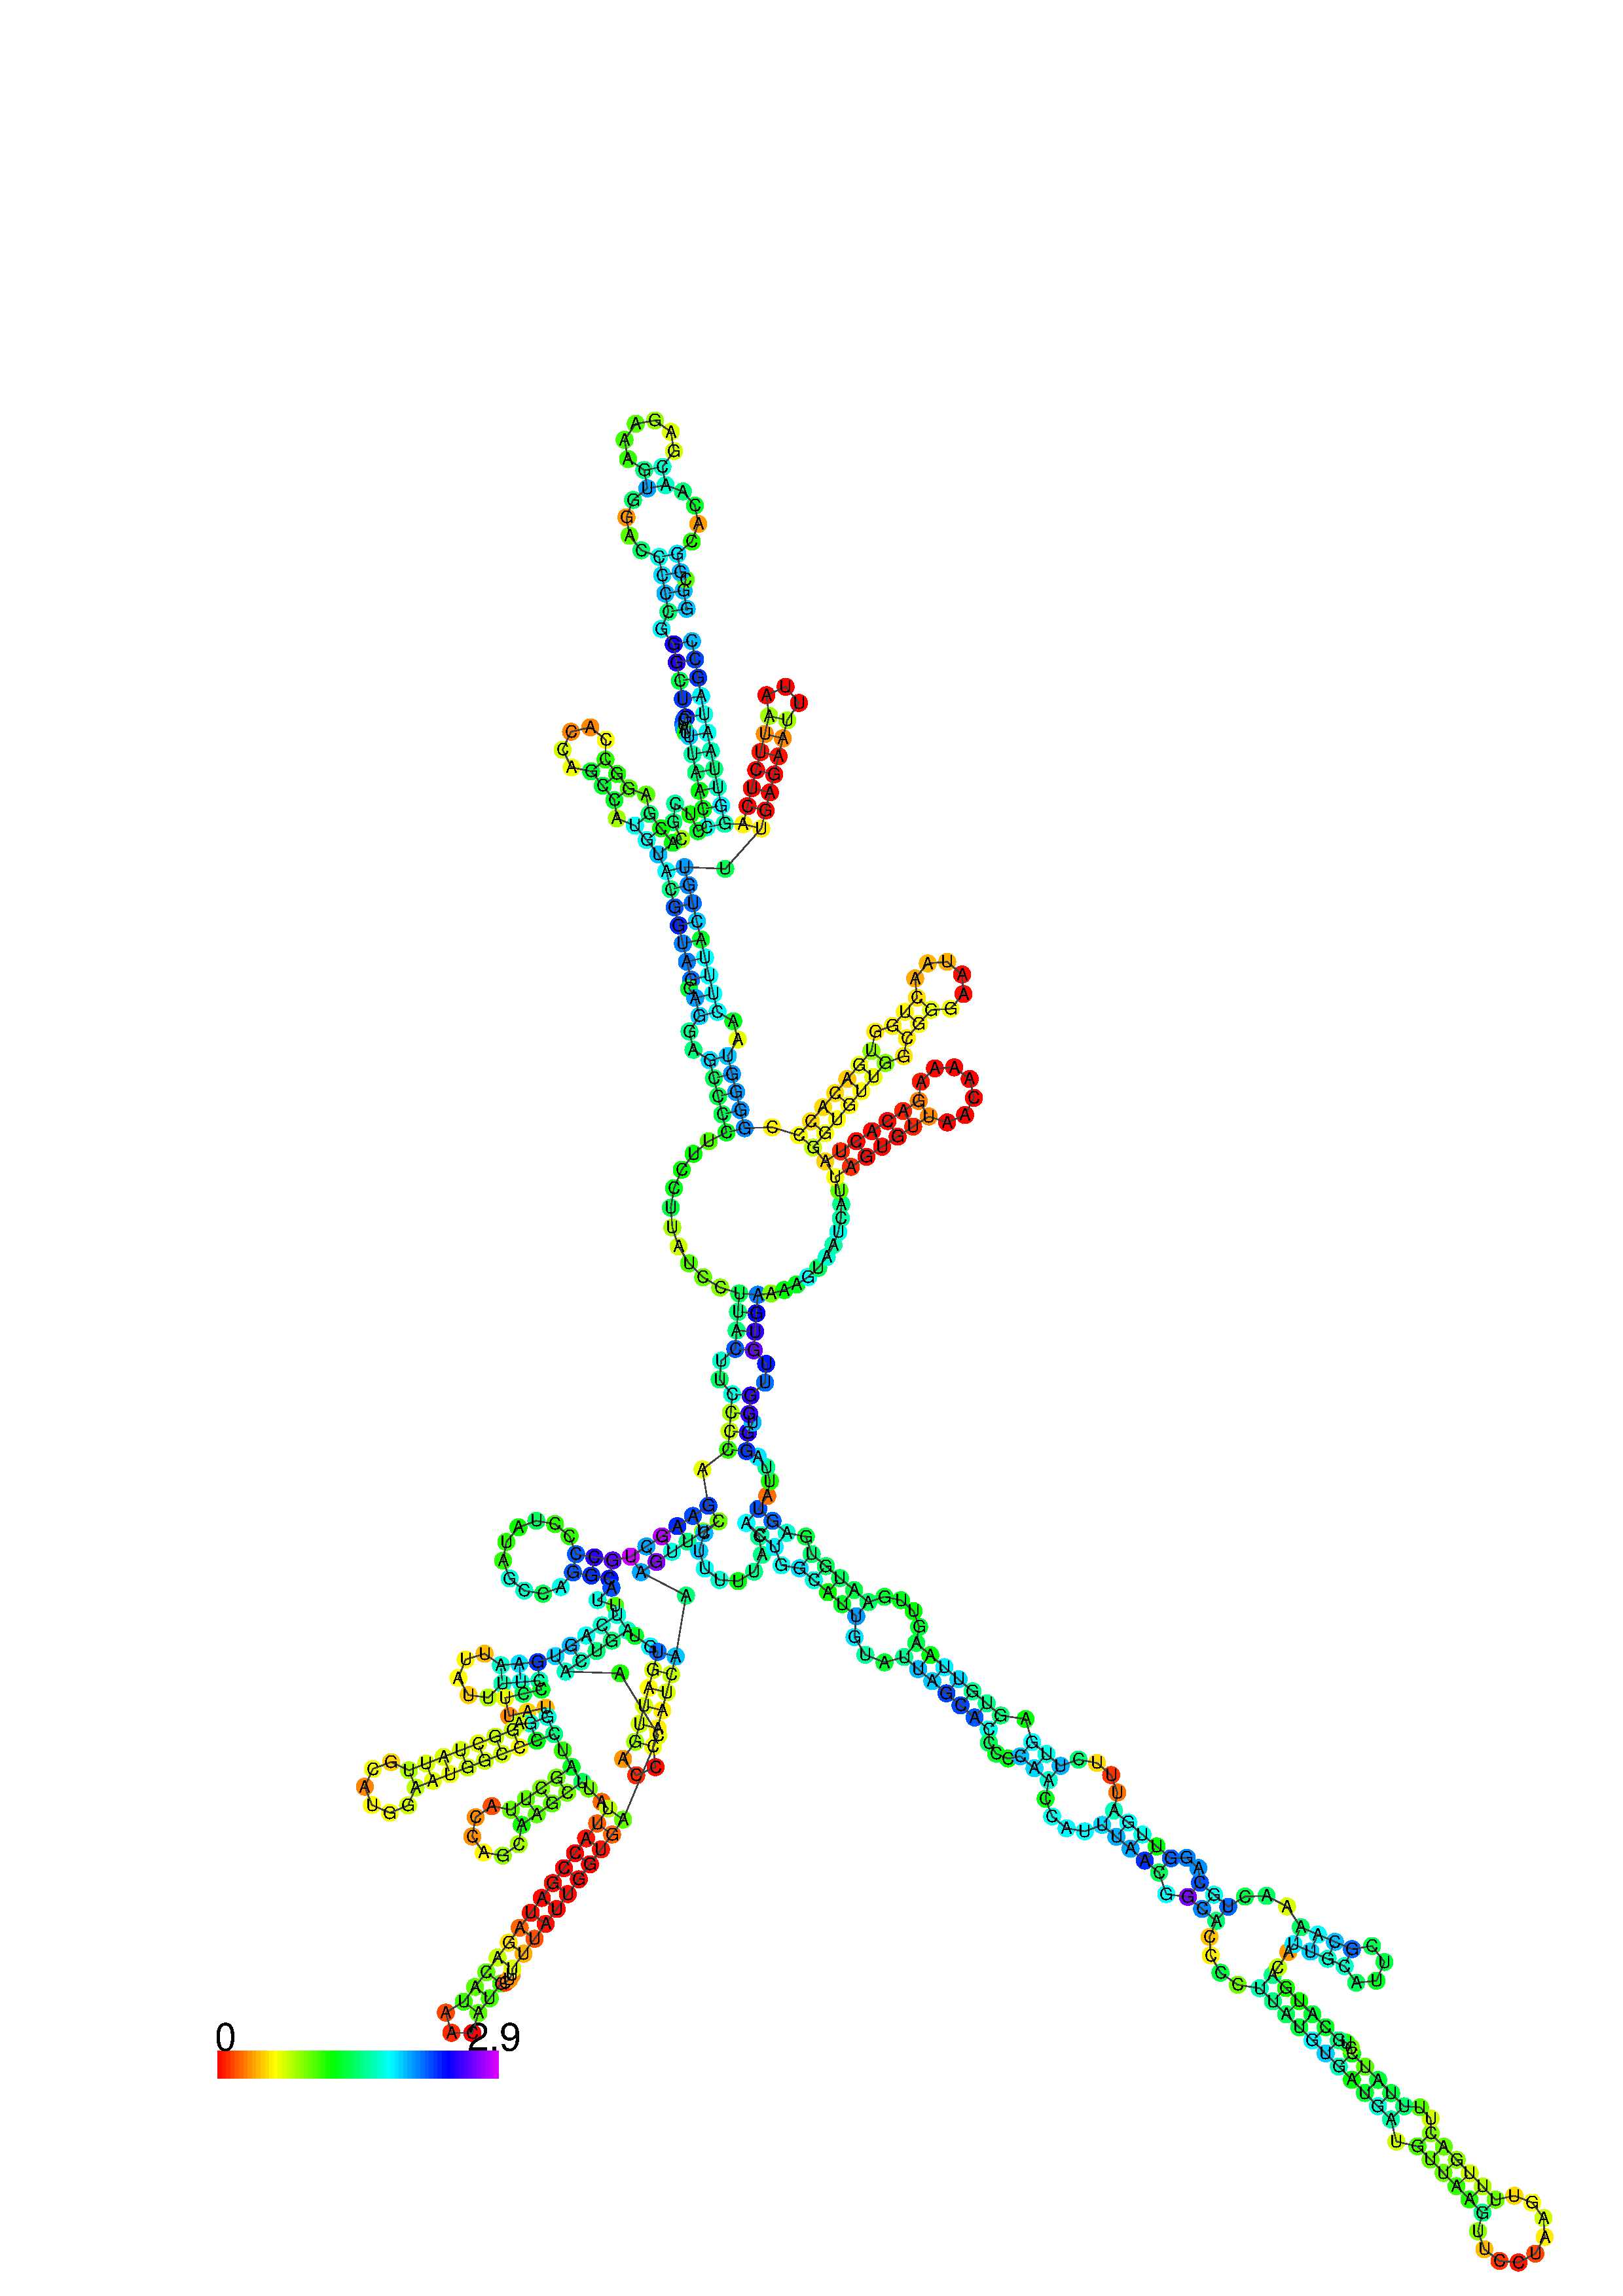
The structure below is colored by base-pairing probabilities. For unpaired regions the color denotes the probability of being unpaired. The reliability information of RNA secondary structure
plot in the form of color annotation, Positional entropy ranging from red (low entropy, well-defined) via green to blue and
violet (high entropy, ill-defined).
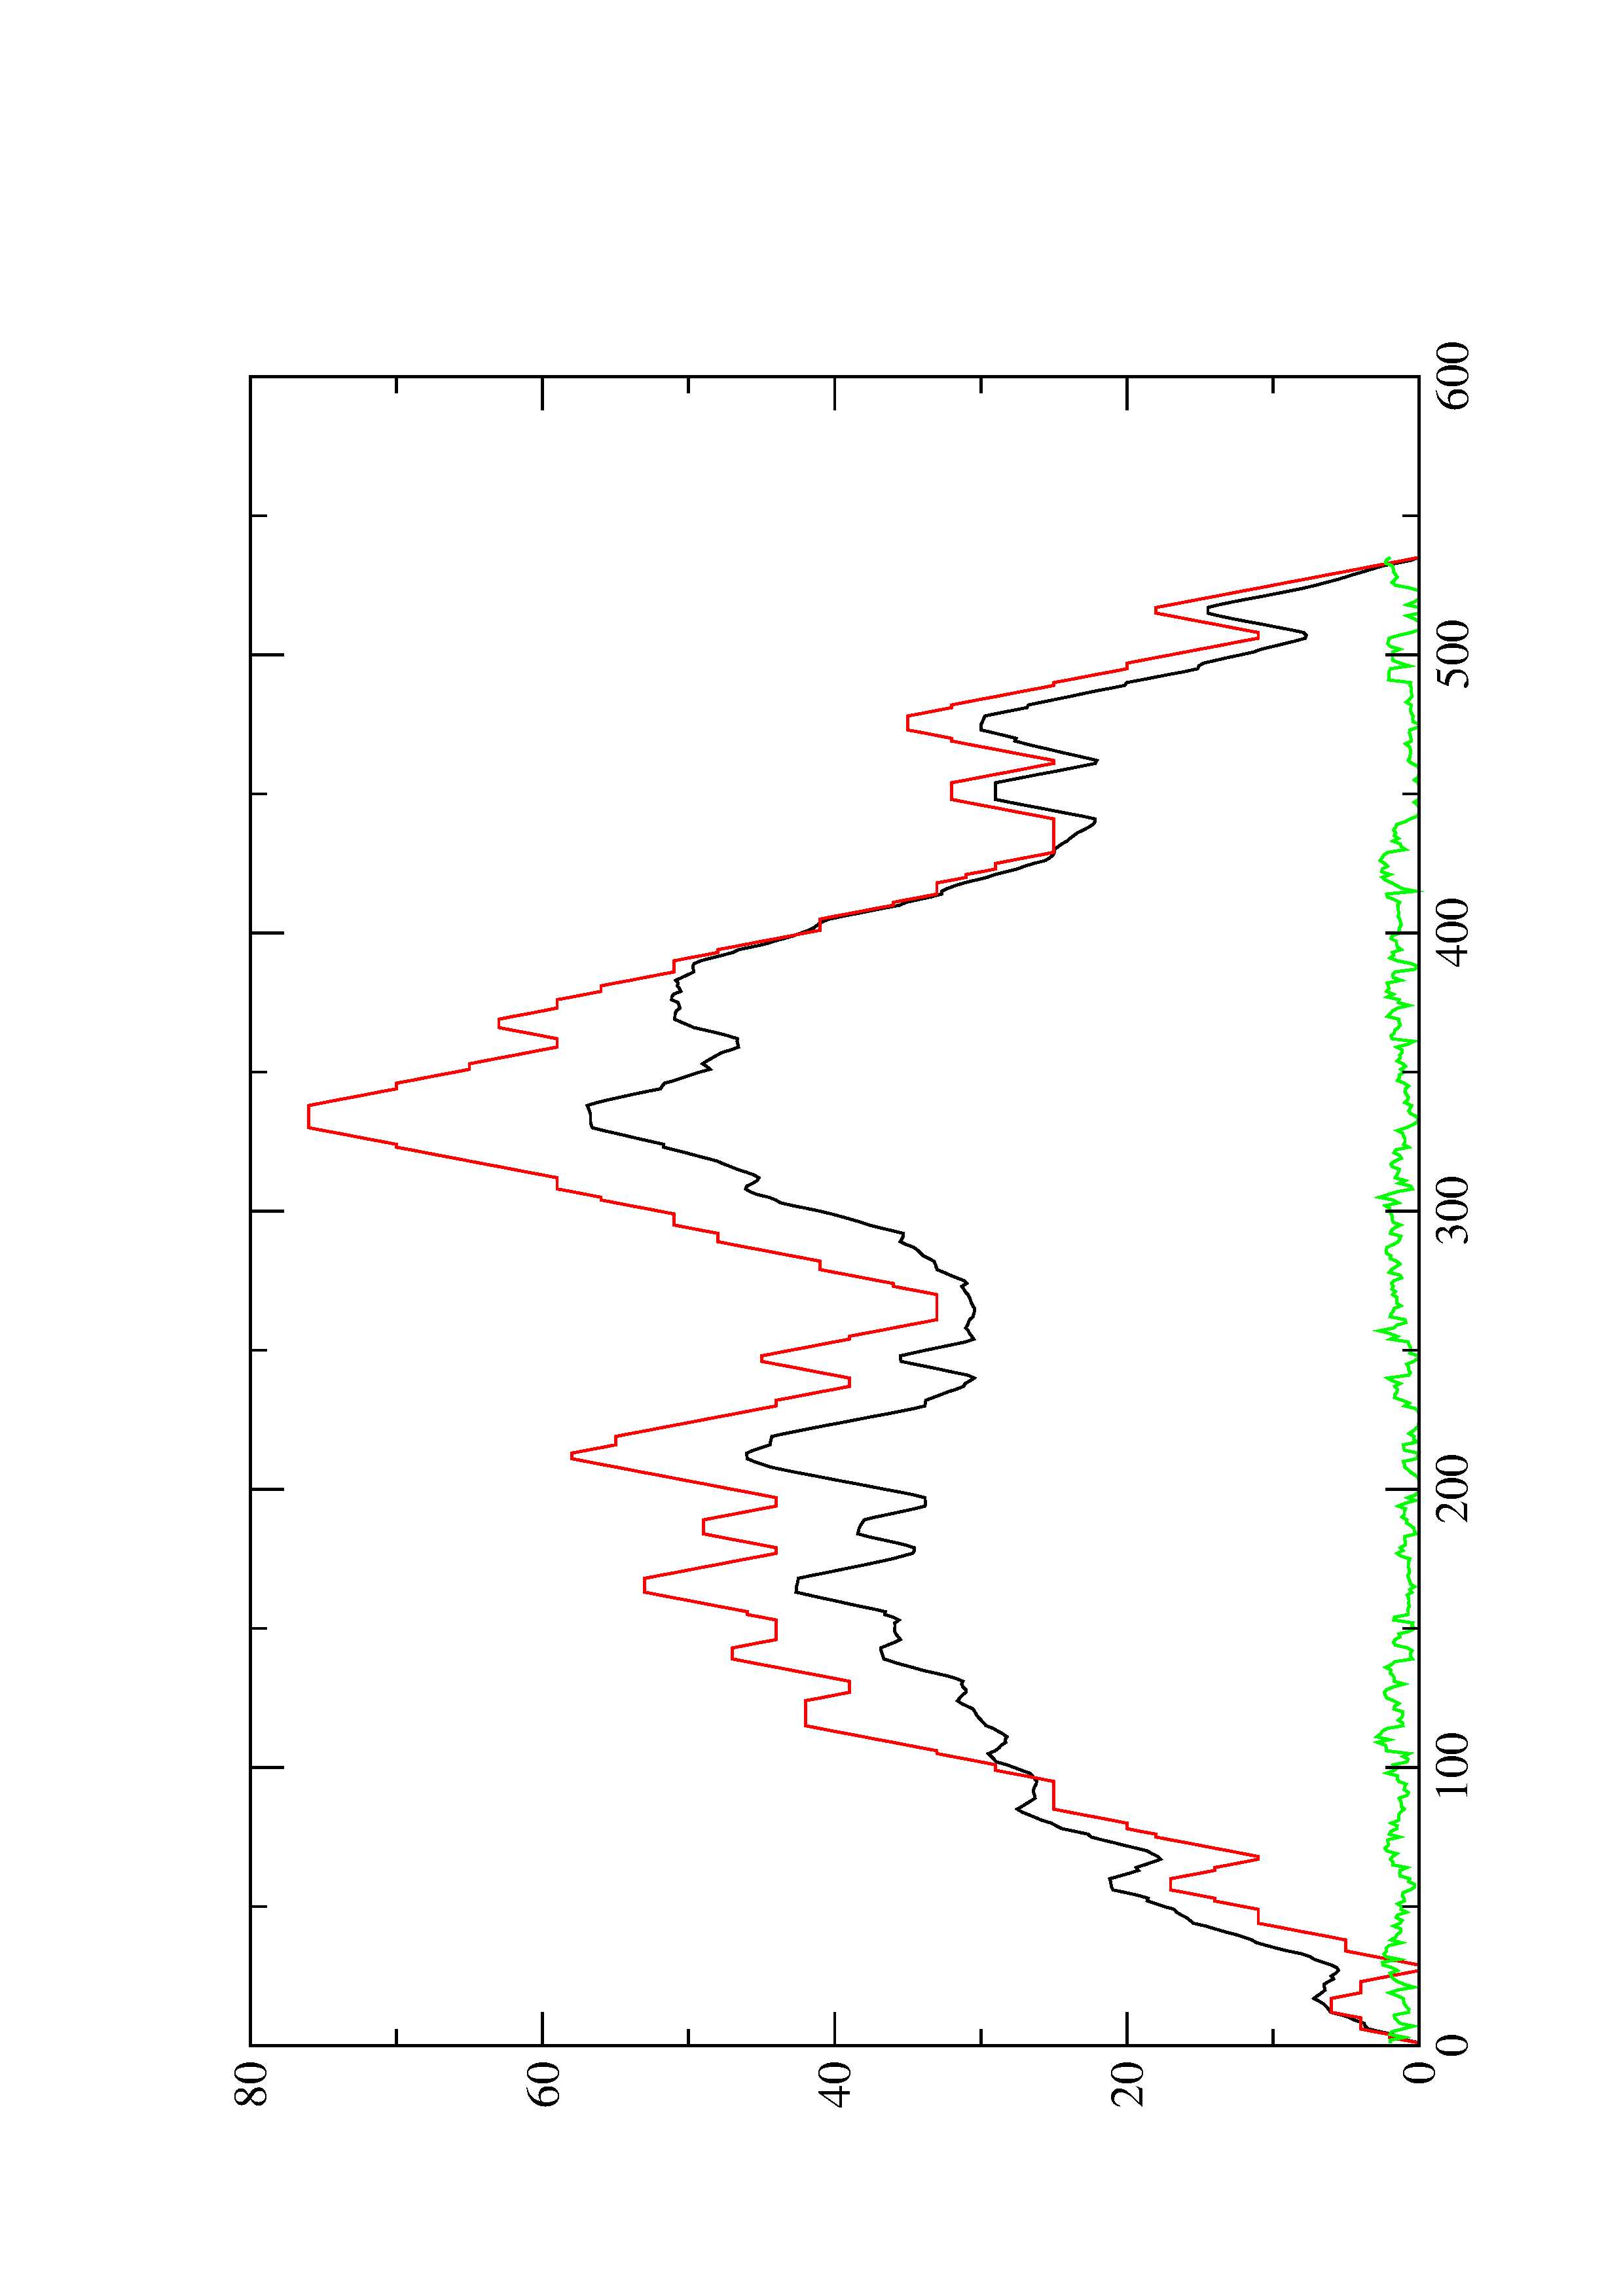
2. Here you find a mountain plot representation of the MFE structure, the thermodynamic ensemble of RNA structures, and the centroid structure. Additionally we present the positional entropy for each position. The resulting plot shows three curves, two mountain plots derived from the MFE structure (red) and the pairing probabilities (black) and a positional entropy curve (green). Well-defined regions are identified by low entropy.