lncRNA Structure Prediction
Species Name : Withania somnifera Sequence Id : GBHJ01005437.1
I. Result for minimum free energy prediction
The optimal secondary structure in dot-bracket notation with a minimum free energy of (-276.10) is given below.
1. Sequence-
CCAUCGUCUCUCCAUUCCCCCUUCAUGGCUUCCUCCGUAAGUUCUUAGUUUCCUUCUUUU
CCAGAAUAGAUACUUUGGUAUUUGUUGGUUAUCUGUGUAAAAGCUCCCGAUUUAACUUGG
ACGCUUGAUGCAUAACUAUUUUCAUGGUGAAAAGUUGAAAUUAGUUCAUCUUAAAAUACU
GCUUUCAAUCAGCUUACUAAUCAAUUUCACAAGAGUAGUAACUAUAAGUCGCAGCUUAAG
GAUAAUCCAUUAUUUUCACUUAACCUUAUAAAUACGAUUUUUCAUGGUUGAUGGUAGAGU
CUCUCUGUCUGAAAUAUUAAUCUGAAAAACAAUAAGCUUCAACGCUUUCACAACUAGAUA
CUCGAGUUUAUCUUAACAAUUACAUUUAUUGAUAUACUCUCUCAAUAAACCACCUCAACU
AAAGAUGUCAUGCGCUUUGGACACAAAGAGGAGAAUUAGCUAACUGAACUUAUAGCAAAG
UAGCGGAAUCAAAUUCACAAAGAAACAUUACUUACGCGCGUUCUUCCAAGUAGGAAGGAC
AAAUUUAACAGUAAUAACAAUGUACGAUAAAUAUUUUAUAUGAAAAAUUCAAAGGUGCAA
ACAAAAGUAUAAUAUUCAUGAUUGUAAGAUGCAUACUUUUAUAAGCACUUGAUUUUAAGC
UAAAACAAUAAAAAUAUUUCCAACUUAUGGCUGCCUAAAGCCAAUCCAAACAGGCUCUAA
AAGGCAAAAGAAAAAUCUAGAAACCACUUCCGCUUCACUUUGCAGUAUCAUUGCCAACUG
AAGCAUUCUUUAGCUCUGGCGAGCUGCUGCUCCAAAUCUUGAAUCCAUUGCUCGUUUCUC
UUCAUAUCUUGACAGCUUUGCCAUGGAUUGCUGCUCCGAGGUAACAACUGAUAUGUGUUU
UUUGGUUCUUCUCCUUCCUCGUUUGAUUCCUGUCUGUAUCCUUUGCUAGUAGUGGUUGAG
CUUCGCUGCAAGGAUCGAAAUUGAGCACAUGCAGCUGAAGAUAUGUCGAAAAUUGAGCCA
UUUAUUUAUAGCAAUUUGCCCUUCUGGUAUCCCUGCUUUCUGUAUUUUGAUUAUCUUUGU
AGAUCUGUUGUUAUUUGGAUAUUCUUUAUUGAGAAGCUUGUGUUCUCCUGUCGGAUUGAU
CUUAUUUACUGCACCUCUUUUCUUUUUUCGAGUUGUUUUCCCUCUCUUGUUGUGUUCUUG
CCUGUCCUCGAUUUUAUUGUUGCAUGAUUCGUCACUUUAGAUUGACUUUGAUGAUCCUAU
CAUUUAUGUCAAUUUUCAAUGUUAAUUUACGAGAUCCUUUUAUUUACAUAAAGCACUUAC
UUUACAGUAAUCGAG
2. MFE structure-
.....(((((..........(((.((((......))))))).....(((.((.((((.....))))..)).)))...((((((((.(((((..((((((.((((..((((......))))..))))..))))))...........(((((((((((((((.((((............)))).))))))).((.((((((.
((..........)).)))))))).(((((....))))).(((...)))....)))))))))))))..))))))))((....)).(((((((((((.((((.(((..((.((((.....................(((......)))))))..)).))).))))((((.((((..................)))).)))).
........))))..)))))))..((((((((((((..((((......(((((......((.....((((..(((((((((.((.((((...(((((..(((((((..............((((((((.....))))))))........(((((((((((((...(((((...........((((...)))).((((((..
..((((((((.((...((....))....))..))))))))....))))))((...((((((....(((((((((((..(((((....(((((......))))).....((((((.(((((((((...((..(((((.(((((...................((((((...((((((.((((((....))))))...))))
))..)))))).........(((((..((.(((((.((.((..((((((((..((((((((((.((((.......)))).))))).......(((((((((((((((((((..............(((....))).(((.....)))..(((((((.......)))))))))))))))))...))))))))).))))))))
)))))..)).)).))))).))..))))).((((...((((.....))))....))))))))).)))))..)).))))).)))))))))).....))))))))).)))))))...))))))...))...))))).))))...))).)))))).......)))))))....)))))...)))))))).)))))))))))..)
)...)))))...))))..)).))))))..)))).....((((((((...((((((...))))))...)))))))).....((......)))))))........((((.(((((......)))))..)))).....
You can download the minimum free energy (MFE) structure in
II. Results for thermodynamic ensemble prediction
1. The free energy of the thermodynamic ensemble is [-301.89] kcal/mol.
2. The frequency of mfe structure in ensemble 6.71344e-19.
3. The ensemble diversity 284.71.
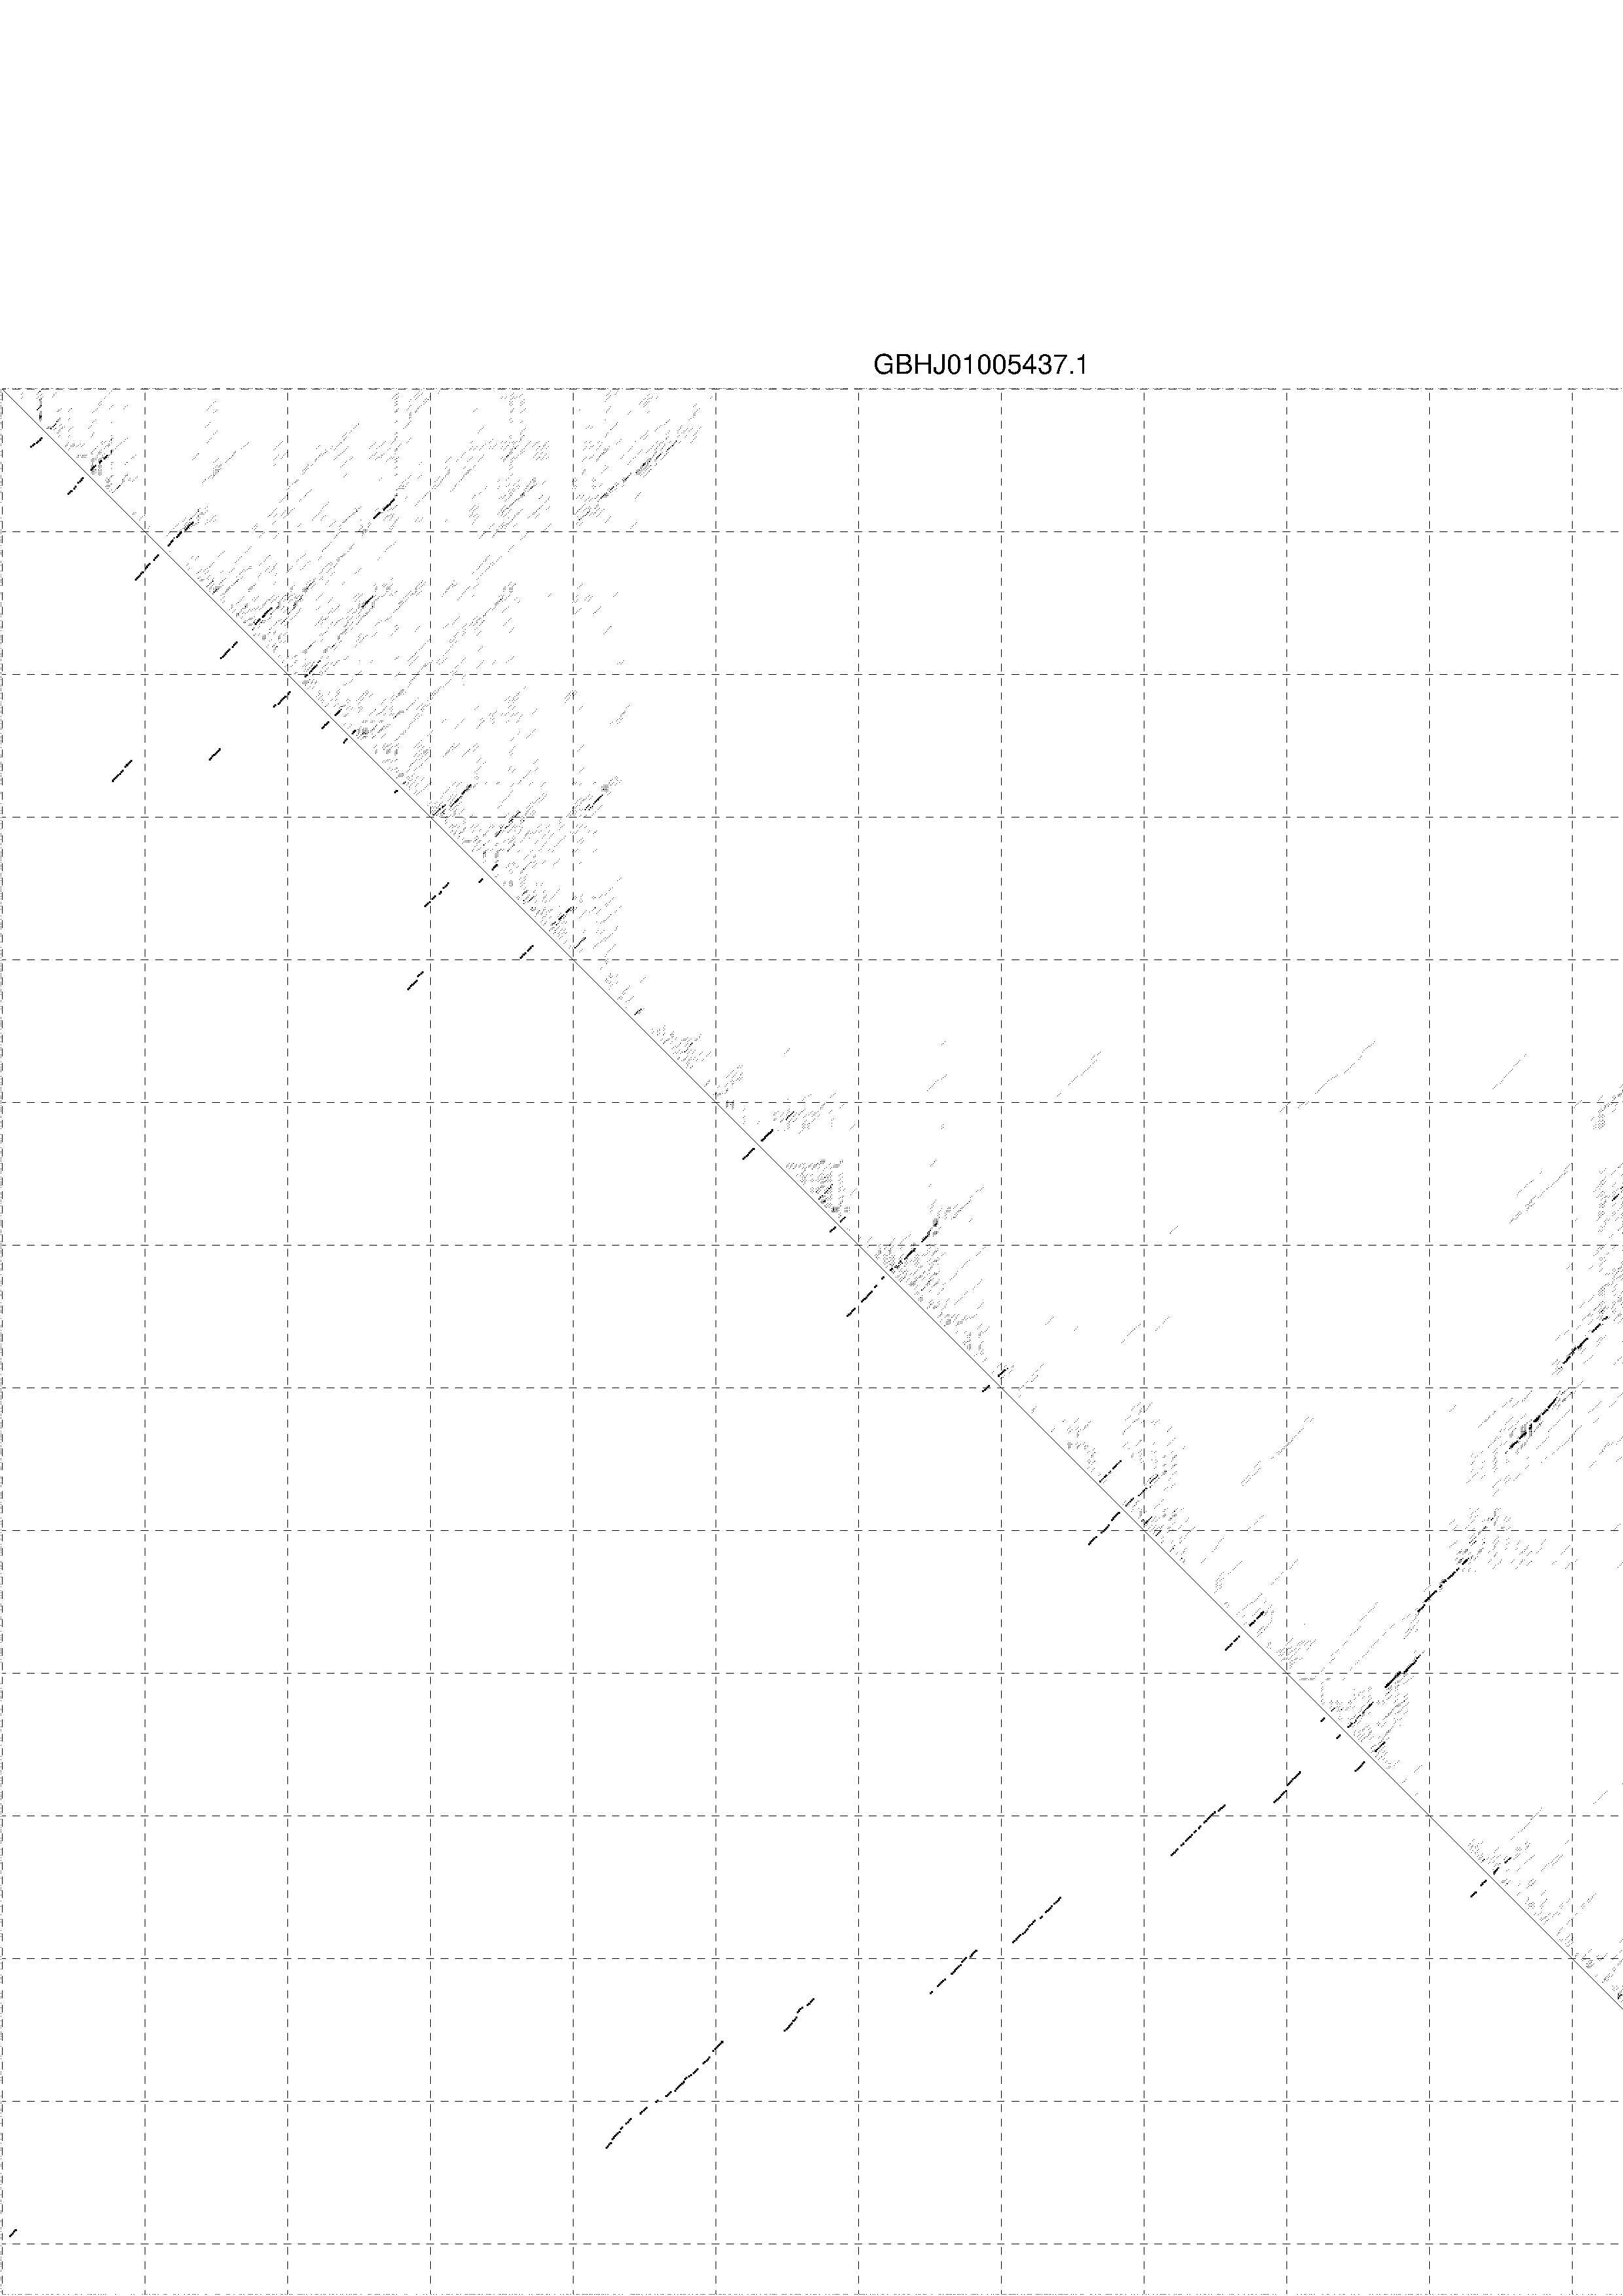
4. You may look at the dot plot containing the base pair probabilities [below]
III. Graphical output
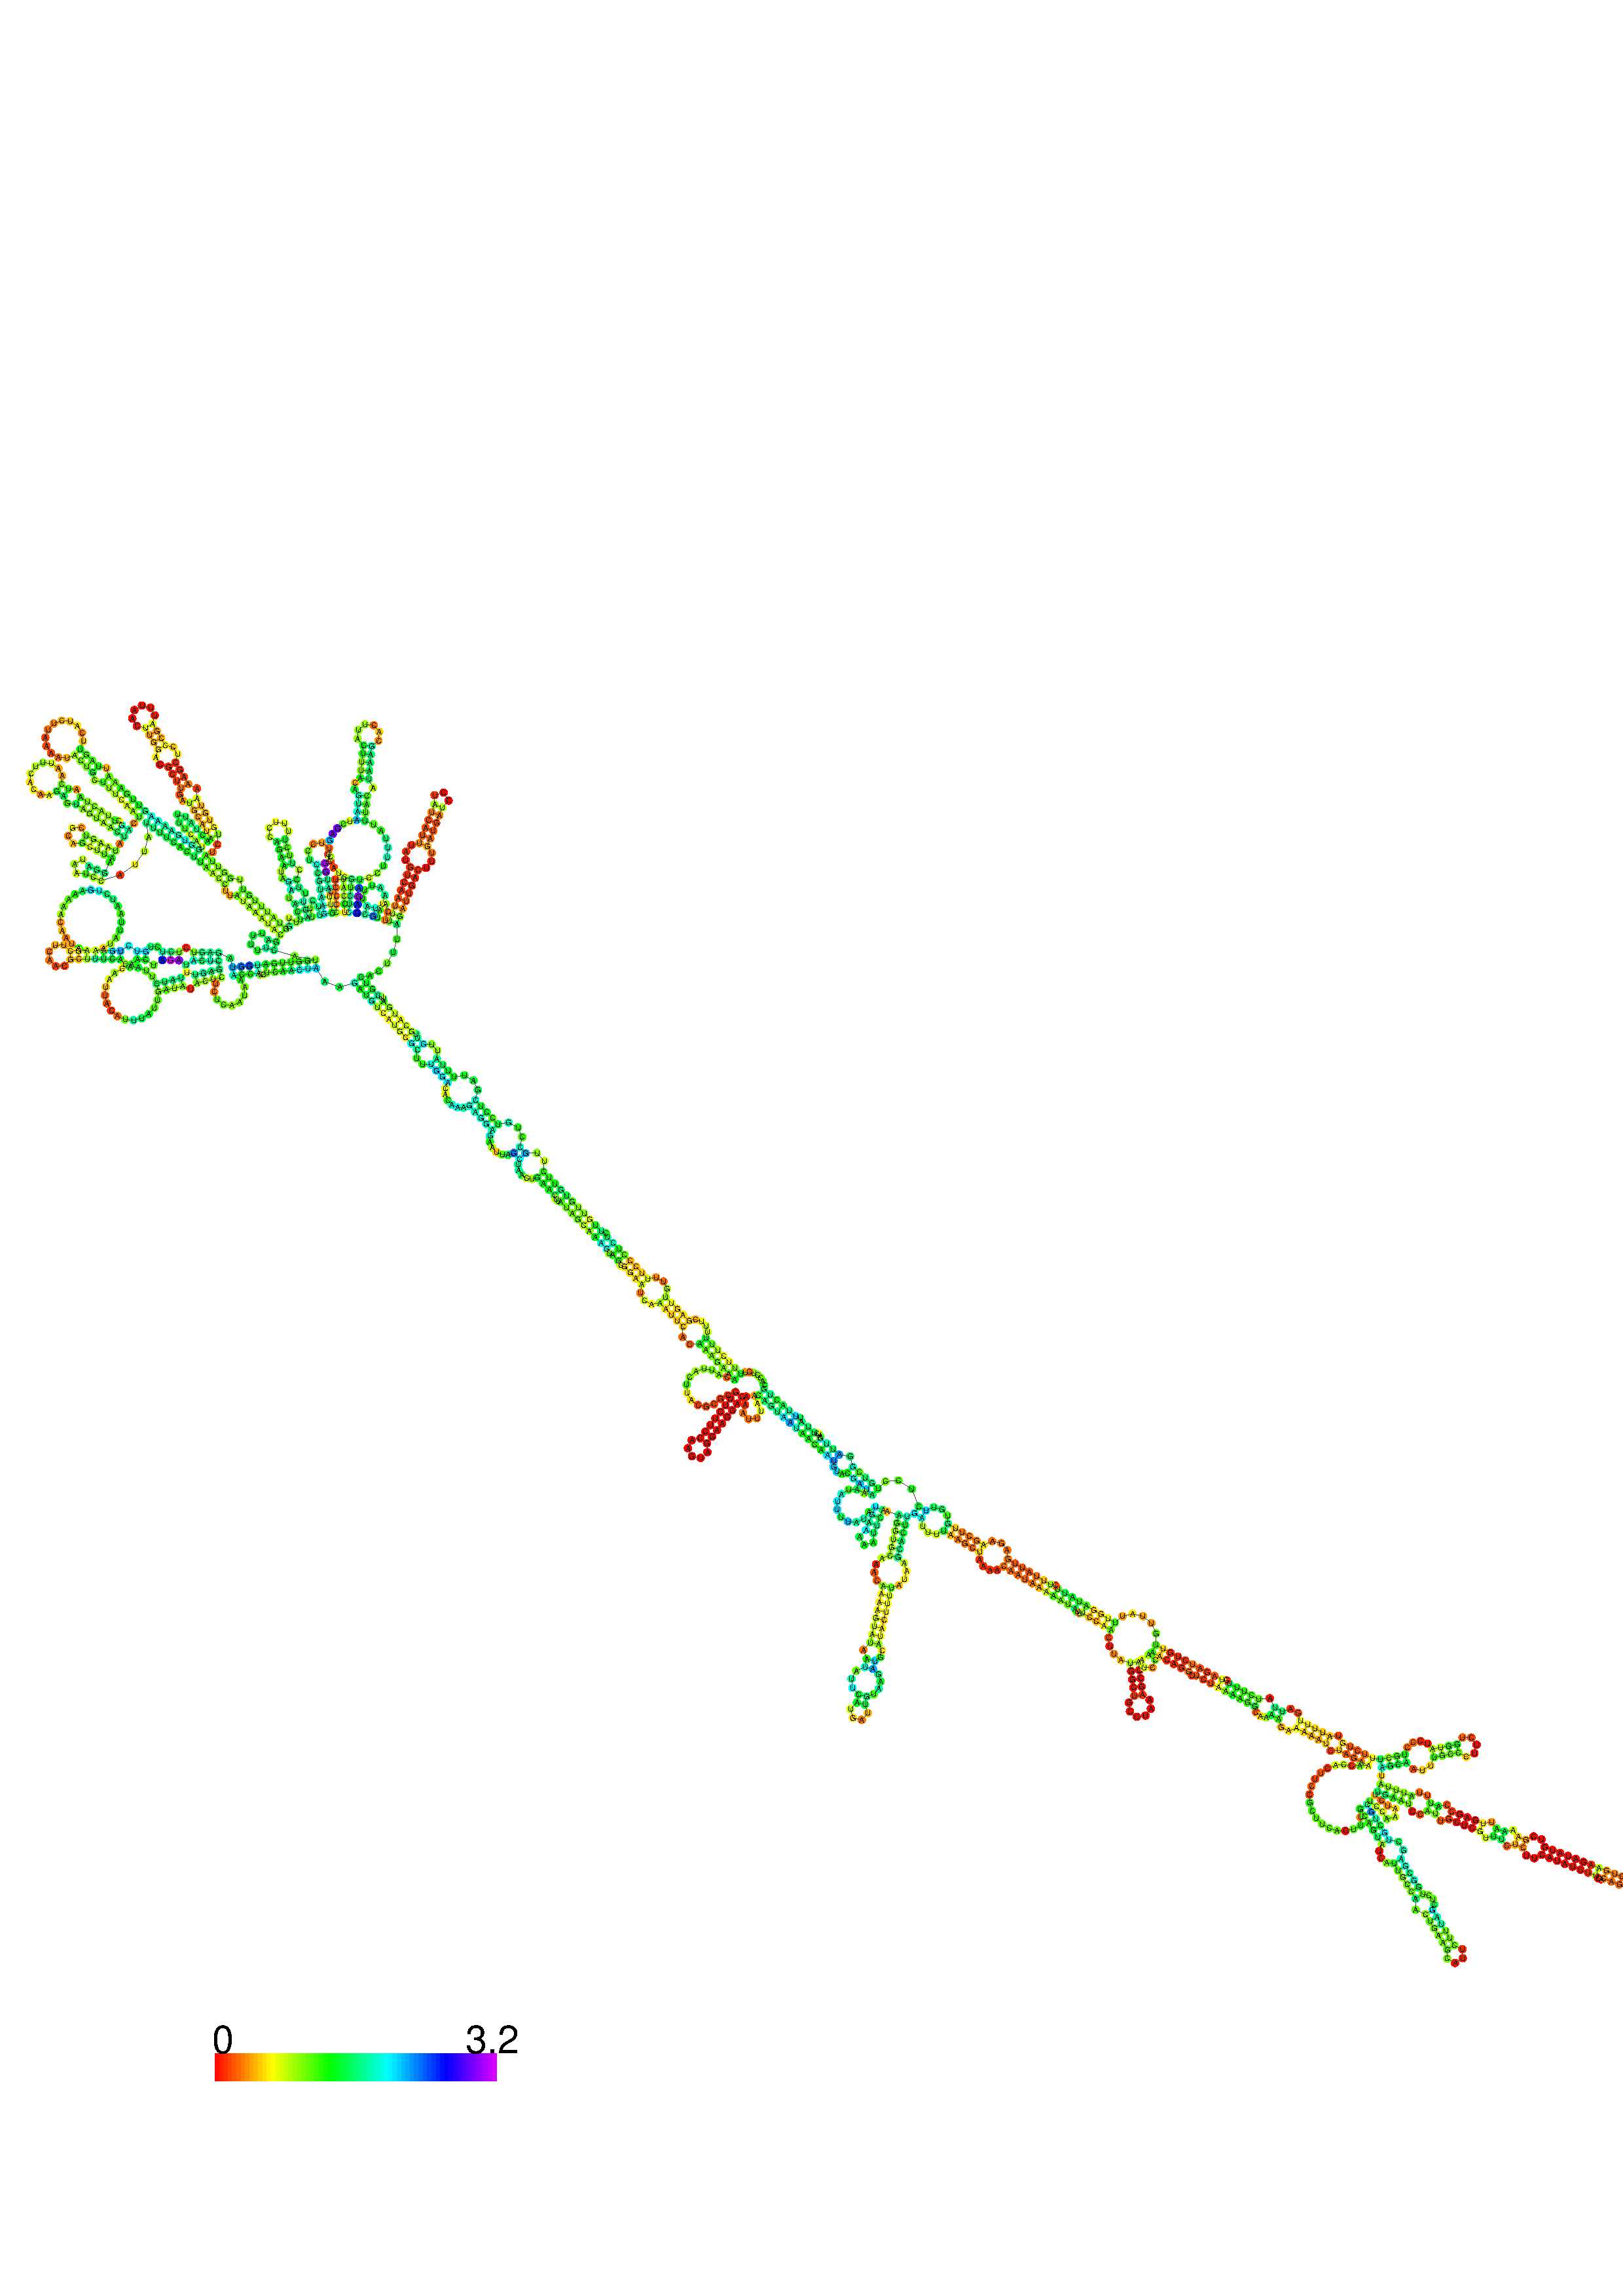
1. A note on base-pairing probabilities:--
The structure below is colored by base-pairing probabilities. For unpaired regions the color denotes the probability of being unpaired. The reliability information of RNA secondary structure
plot in the form of color annotation, Positional entropy ranging from red (low entropy, well-defined) via green to blue and
violet (high entropy, ill-defined).
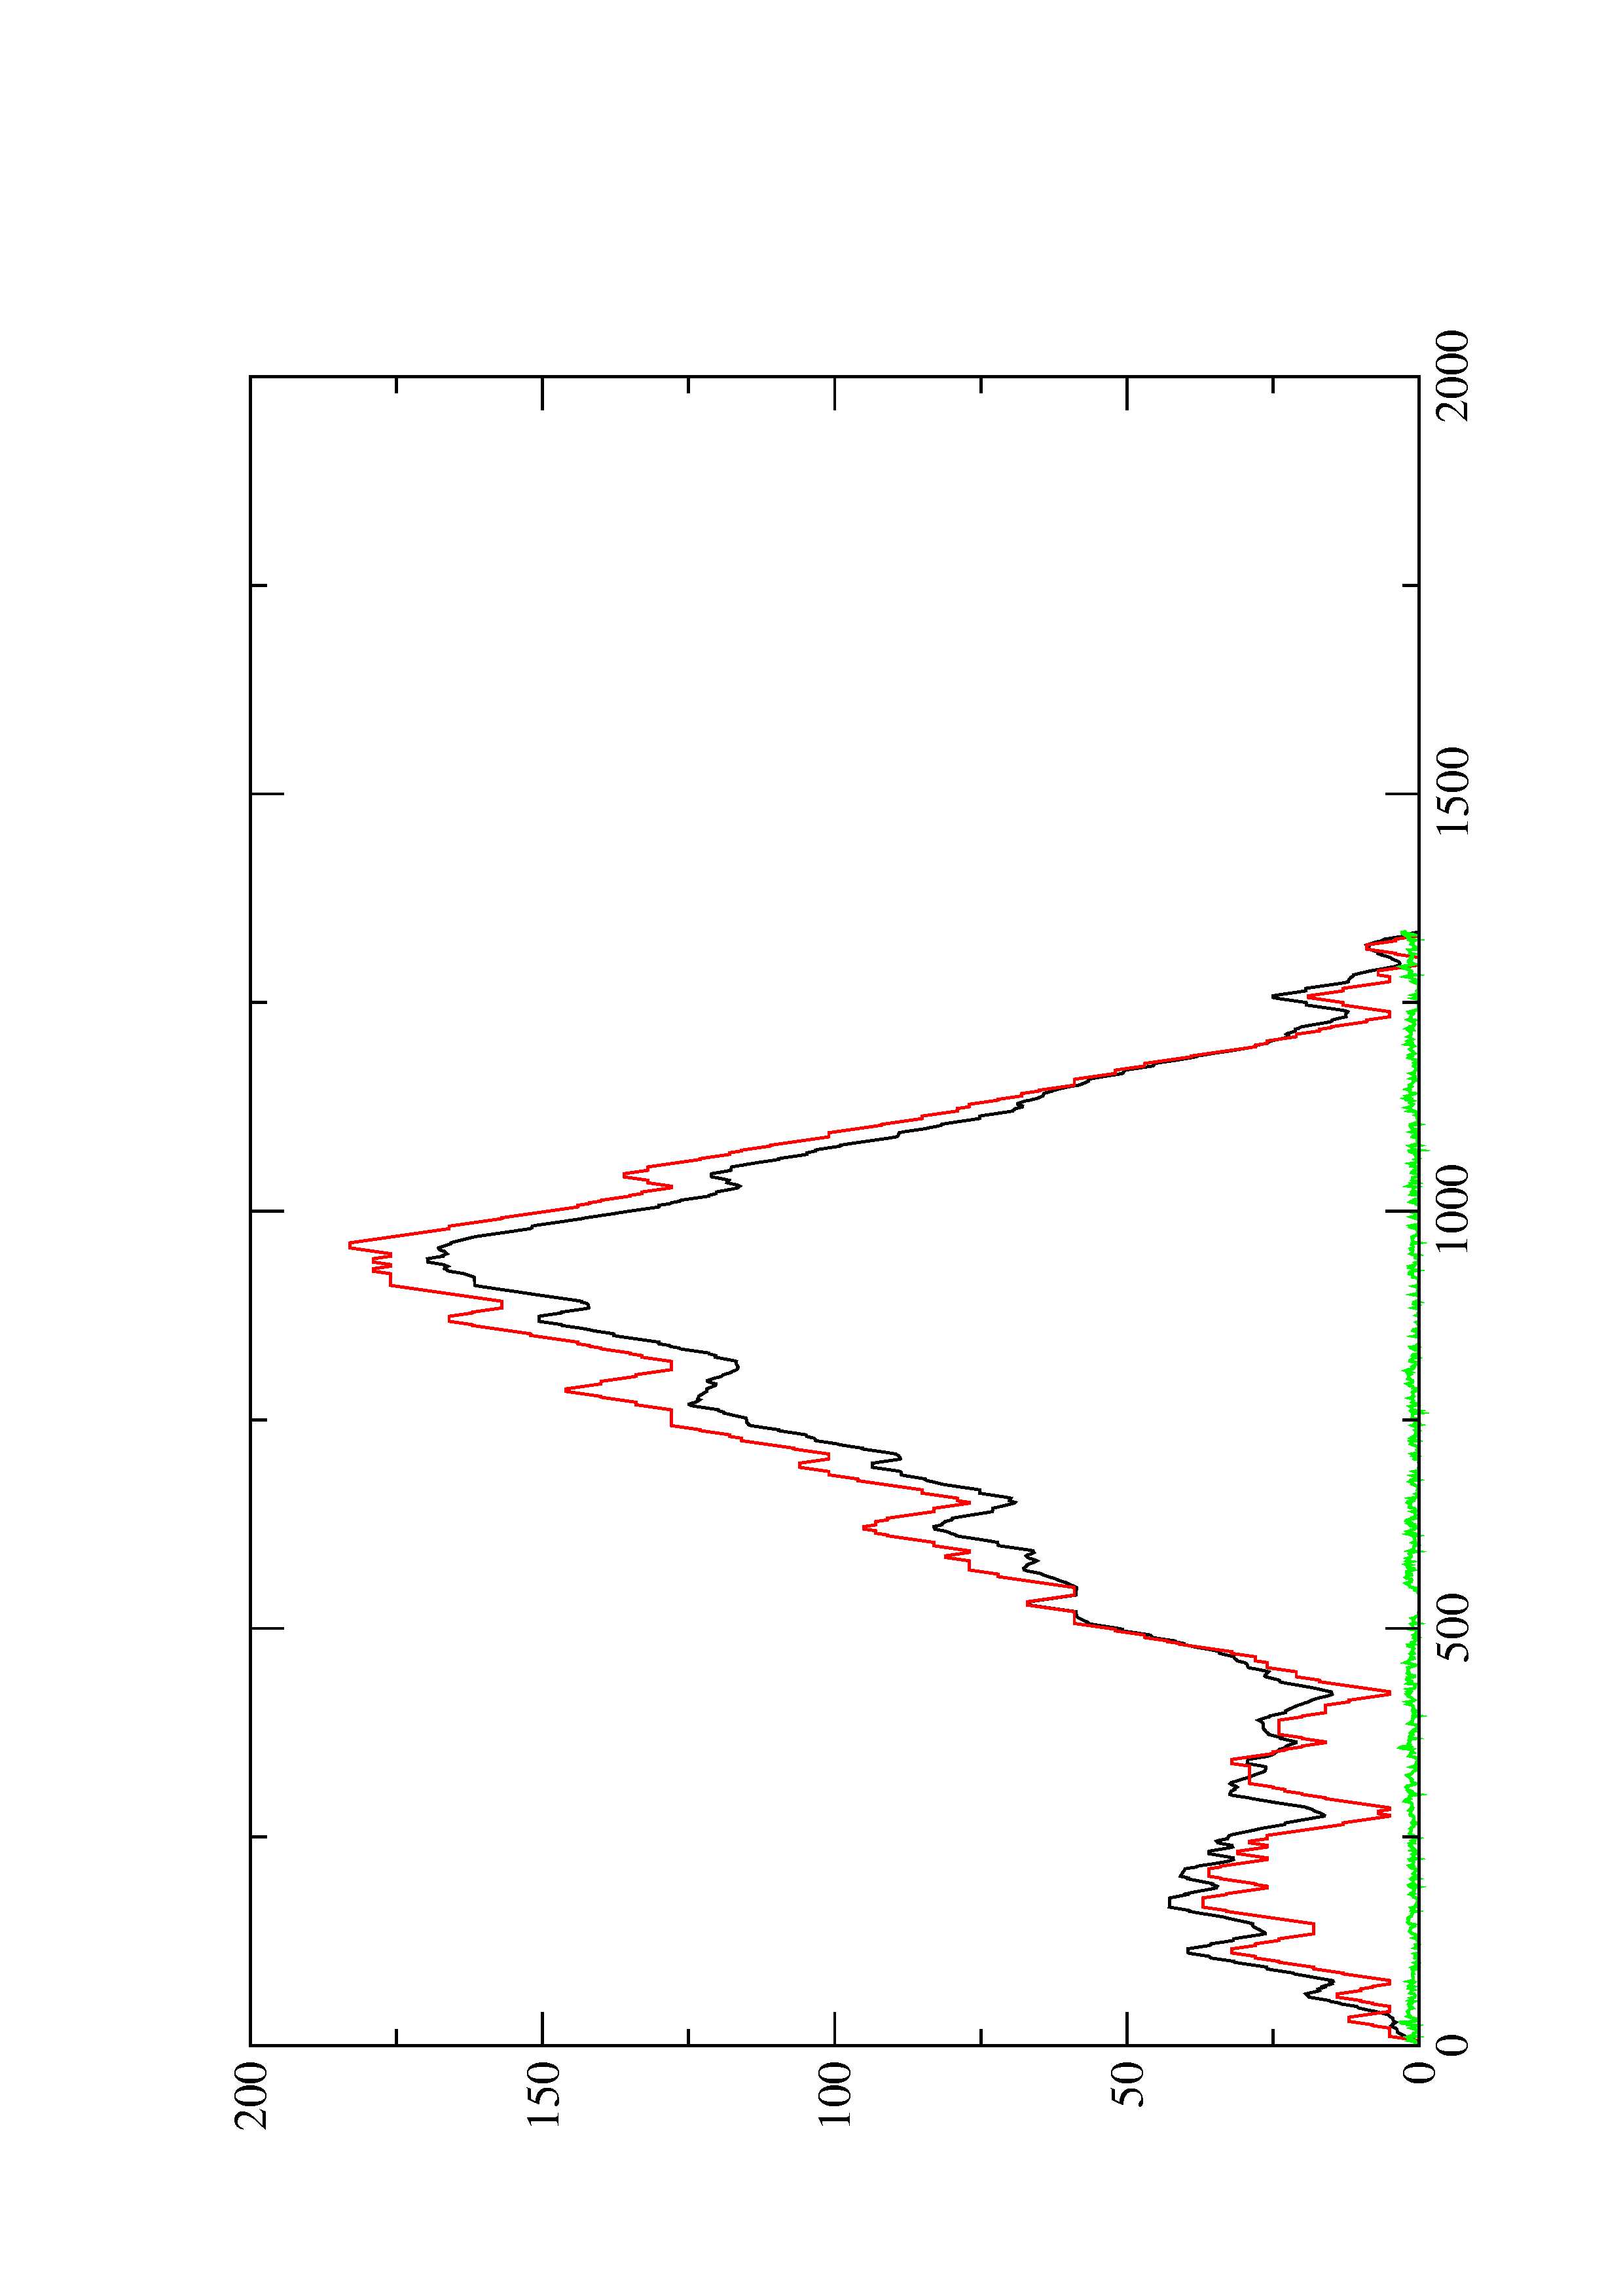
2. Here you find a mountain plot representation of the MFE structure, the thermodynamic ensemble of RNA structures, and the centroid structure. Additionally we present the positional entropy for each position. The resulting plot shows three curves, two mountain plots derived from the MFE structure (red) and the pairing probabilities (black) and a positional entropy curve (green). Well-defined regions are identified by low entropy.