lncRNA Structure Prediction
Species Name : Withania somnifera Sequence Id : GBHJ01011071.1
I. Result for minimum free energy prediction
The optimal secondary structure in dot-bracket notation with a minimum free energy of (-310.64) is given below.
1. Sequence-
AUAAUGUCCUCCCAAGAUCUUACUCAGUAACUGAUUUAAAACUUGAAAGCUCCUACCAAU
CAAUGAAUCAACUUACUUUACAGAAAUGGUUCUGUACGCUUUACUAAUCUCAUUAAAACC
AAUAAAUAAACAAAUAAACCAAUUCUCUAUGAGCUGGAAAAGUUCUUUAUAGAAACCACC
CCUUCAGUUGUUUUCUGGAAACACCAAUUAUUGUAACUGGCAUAUAGGUUAGACAACAAA
AACUUUAUAUUUUUGGUAUCAUUAGGUUUAAAACAAUAGCUACCUACUAGCAGAAACUUG
AUAUUUUUGGUAUCUGUUCAACAAAUUUACCUUGAUAACACUAUUGAAAACUUGGUUUCA
UGAAGCAUUGCAUAAACAAUCUGGACUGAGAUGAAUCAGAGAUAUUUUGGUGACAAAAAC
AAUAUUUCCGCUAAAGGUUUGCCAUACAAAGCUGUAUUAUUAAUCUGACUCUUAUUAACC
AUCUGGUGCACAGUAUUAGUCUUCUUAUAUUAGCUGUCUAGUCCAUCAACAAAAGGAAUA
UUACACAUCACUUAAUACCAUACCGAGAAUAUGGCCCUAGAUAGUAAGGUAUGGAGCACA
CGUAUUAGGGUAGAAGGUUAGUAGAAUGGAGUUCGUUCUUGCCAGUAGGUAGGUUGCUCC
UGCCCGGAGCCAUAGUGGUUCCCUUGUAAUAUCUUGUUCUUGAAAUUUUGGUGGAAUUUA
UUGUUUCGAGUAGAUCGAACGUAUUAUUAUUUUGUGAUAAUCUUGCUUUCACUACUAUCU
GUUGUUGUUUACUACACAUUGUUCGGAAUUUUUUUAUUAUGUCCUUUUUCUAGACUAGUU
UAAUUUGAGCCAAAGAUCUACAUGUAGUGAUACGGACUGCGUACACUCUACCUCCCCAGA
CCCCAGACCCCACUUCUGUAGGAAUAUACUAGGUAUGAUAUUGUUGUCGACUUGAUACCA
UAGUGGAAAAGGUAUAGUUGCUACAAGUCCUGCAAUAAUUUUAUAUACUUUCUGCGCCUA
AUUUUAUAAUAAUCAGUUGCCAUAUACAAGUGUAAUUUGAUAGCAAGGGCCAUAAUUUAA
CCAGGCUGGUAAAUGGUGAGACUAGCGCAGUGGCCACUGGCCAAUGCAUUUUCCCGUUUC
AGCCAUACCAGUCUGUUGACGAUCCUCAGUCAUUCAAAAGAUCGAGCGGAUAAGCUAGCA
UUGUCUCAUAAGAUUAAUCGAGUUUCAUUACCUUCAUGUACCUCCUUCCCUAAACUCUGU
CAUGGUCUAAGAUACCACAAGCACUCAAAGGAGCAUCCAAUAUUGACACAAACACAAUGG
AUAACUUUCUGGGCAUCUAAUAACUAAAUGAGACCUGAGCAUUGAACUUUAUUCACAAGA
UGCCACAGGAAUUACAUAGAAAUGCCUCAACCGCACUCCAAGGUGCAAUUCCCUGUCAAA
UGGUAUGGAUCCCCAAC
2. MFE structure-
...............(((((((((..((((((((((............(((((((((.(((..(((.(((.((((...(((((((....))))))).(((((.(((..(((((...................................))))).))).))))).((((((.(((((((....((((((((((.((.((..
..(((((....((((((((((......)))))............)))))...))))).....(((((..............)))))..((((((.(((.((....)).))).))))))...........))..)).))))..))))))....))))))))))))).((((......))))......)))).))).)))..
)))...((((((................))))))(((((....(((((....)))))....)))))((((..(((..(((....))).....)))..))))...........((((((((((((..........)))....................(((((.......)))))..)))))))))..)))).)))))...
...(((((((((((((((..((((((((((((.....((((((....))))))..)))))(((..(((((((...)))))))...)))............((((((..(((......)))..))))))(((((...(((.(((..((((((....))))))..))).))).)))))...(((.((.....)).))).(((
((..(((........((((((.((((((((((((((.(((((...)))))...)).)))).....((((.((((.....)))))))).....(((.((((..............))))..)))....(((((((((....(((....)))....))))).)))))))))))))))))).........))).))))).)))
))))..))))))))).))))))........))))))))))....(((....)))(((((((((...(((((((........((((((((((..(((((((((.((.(((.(((((...))))).))).)).....)))))).))))))))))))).((((........)))).......((((....((((((.......
)))))).....))))....((((((..........................))))))....)))))))............(((((....((((.(((((...(((.........))))))))...((((((((((((((((((...((((.........)))).....)))))....))))))).)))))).........
..(((.......)))))))..)))))......))))))))))))).)))))......
You can download the minimum free energy (MFE) structure in
II. Results for thermodynamic ensemble prediction
1. The free energy of the thermodynamic ensemble is [-337.85] kcal/mol.
2. The frequency of mfe structure in ensemble 6.73621e-20.
3. The ensemble diversity 405.82.
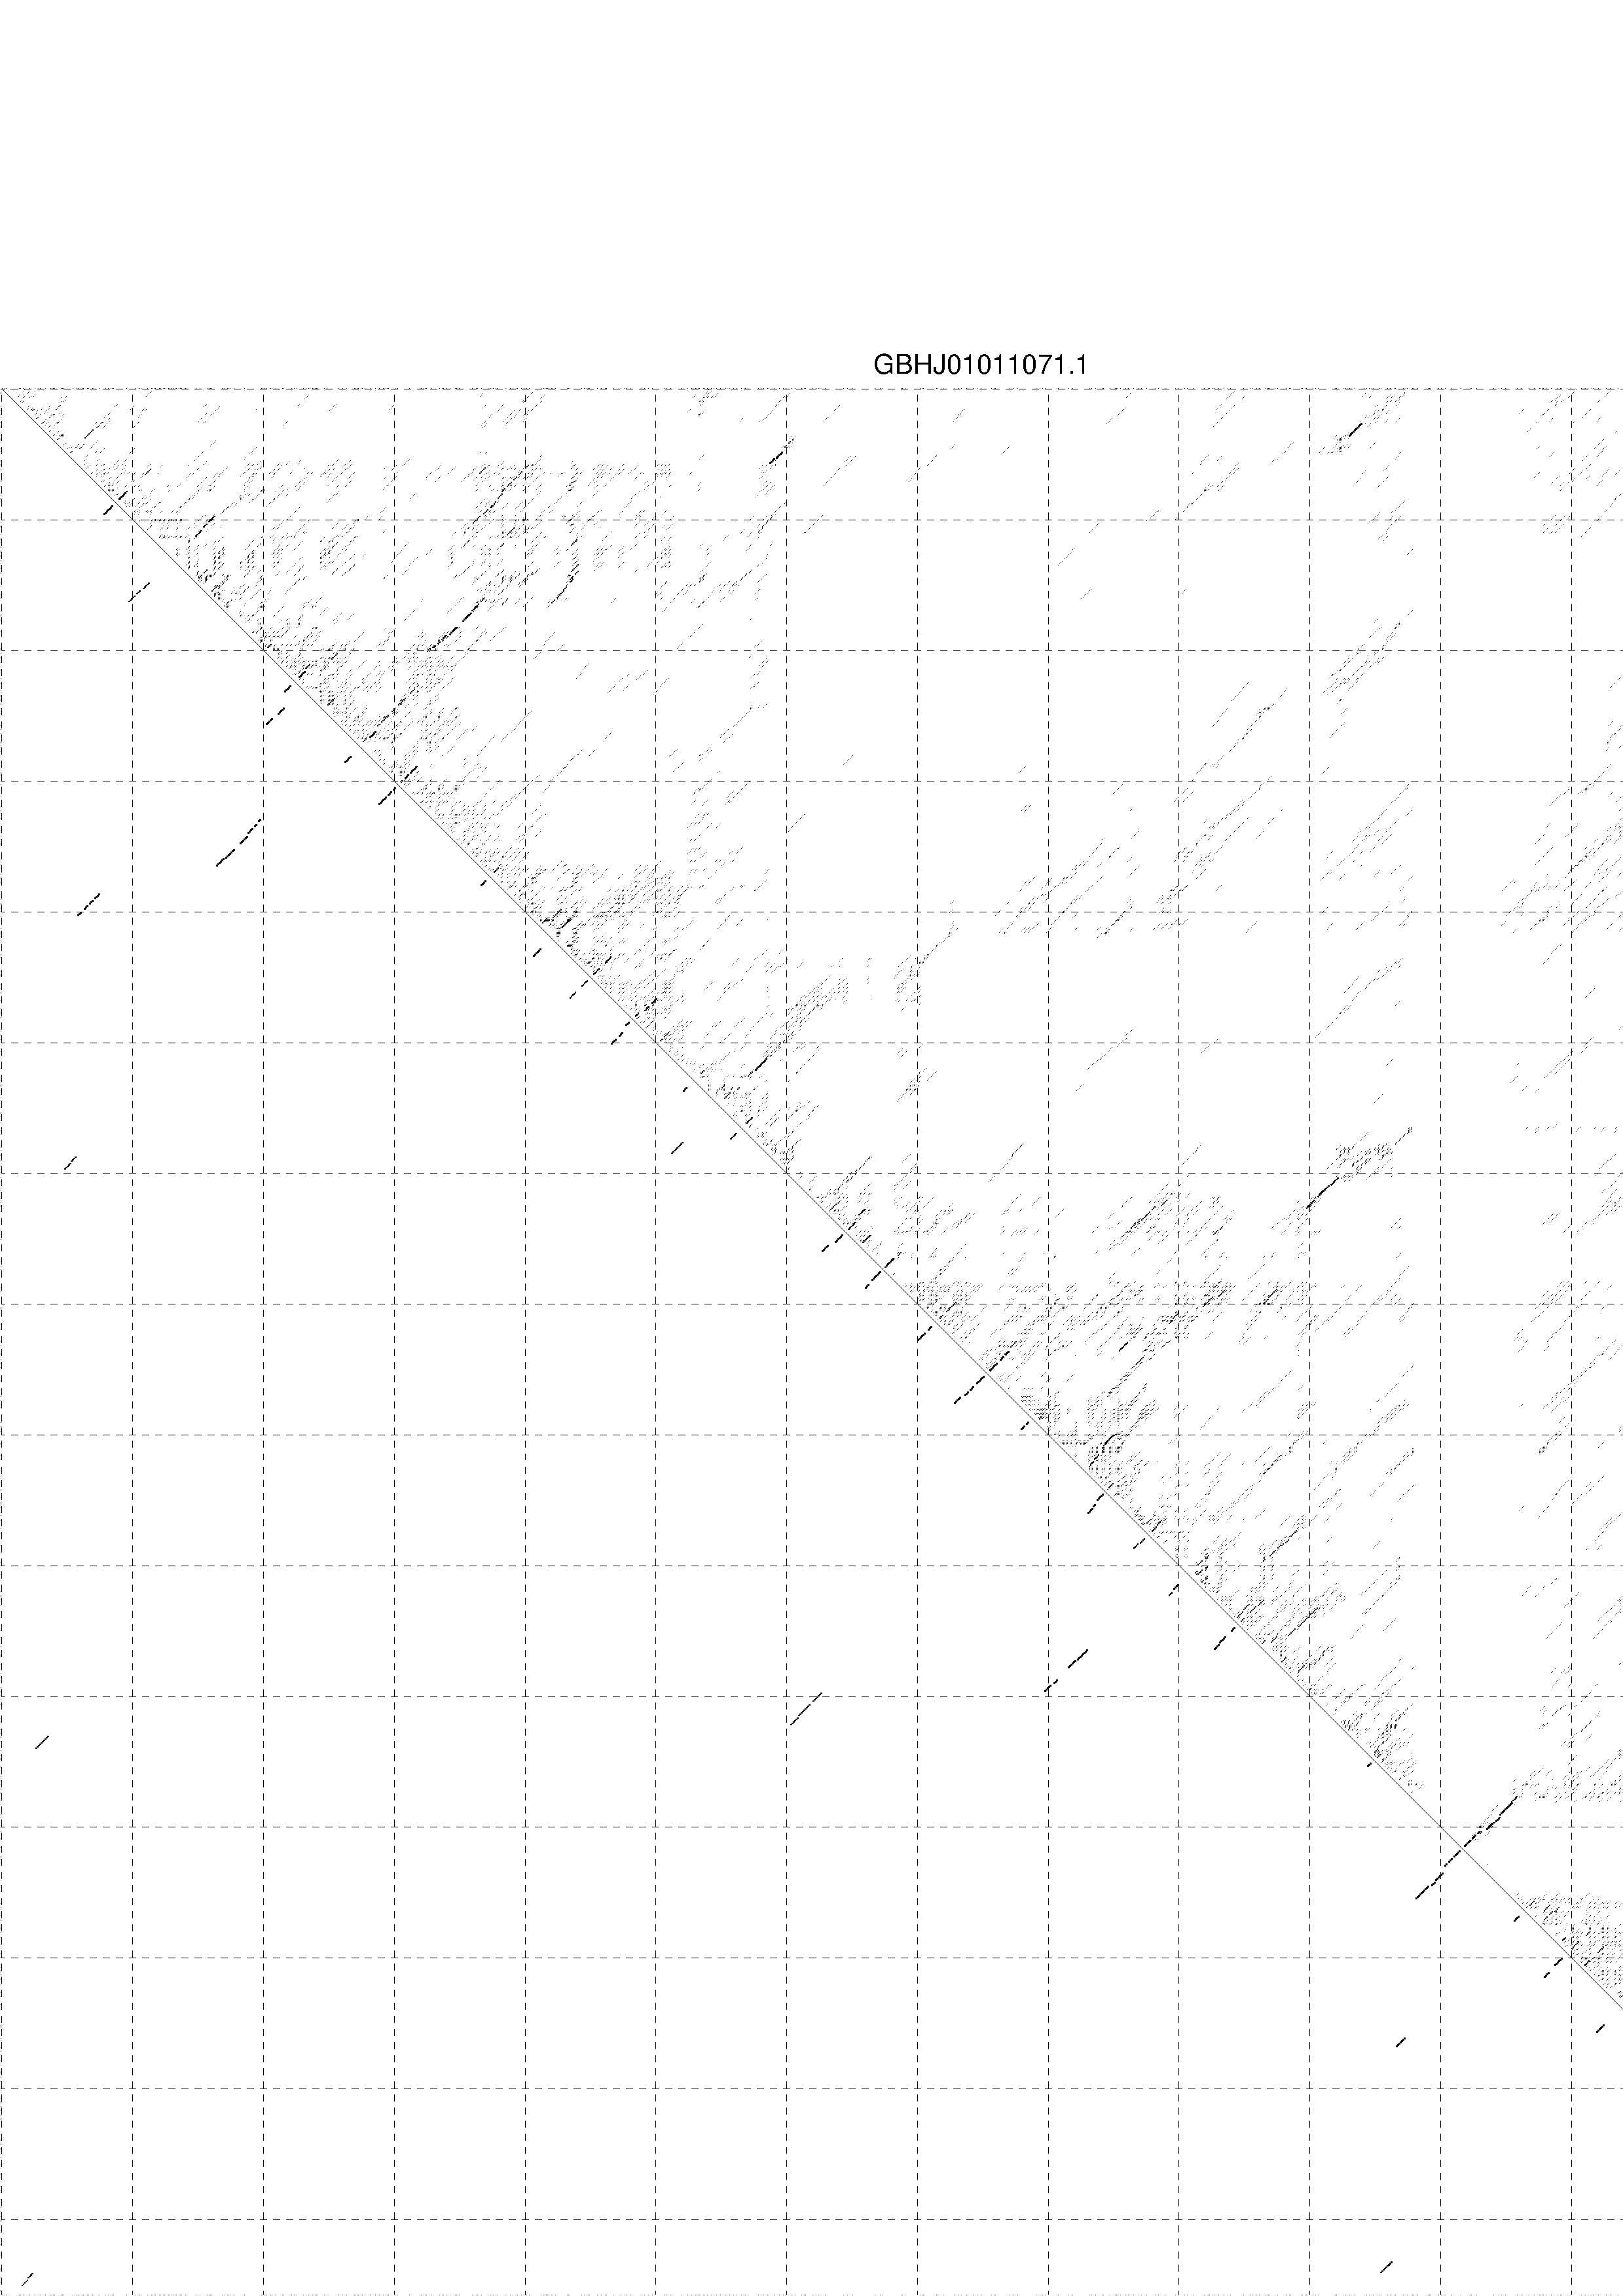
4. You may look at the dot plot containing the base pair probabilities [below]
III. Graphical output
1. A note on base-pairing probabilities:--
The structure below is colored by base-pairing probabilities. For unpaired regions the color denotes the probability of being unpaired. The reliability information of RNA secondary structure
plot in the form of color annotation, Positional entropy ranging from red (low entropy, well-defined) via green to blue and
violet (high entropy, ill-defined).

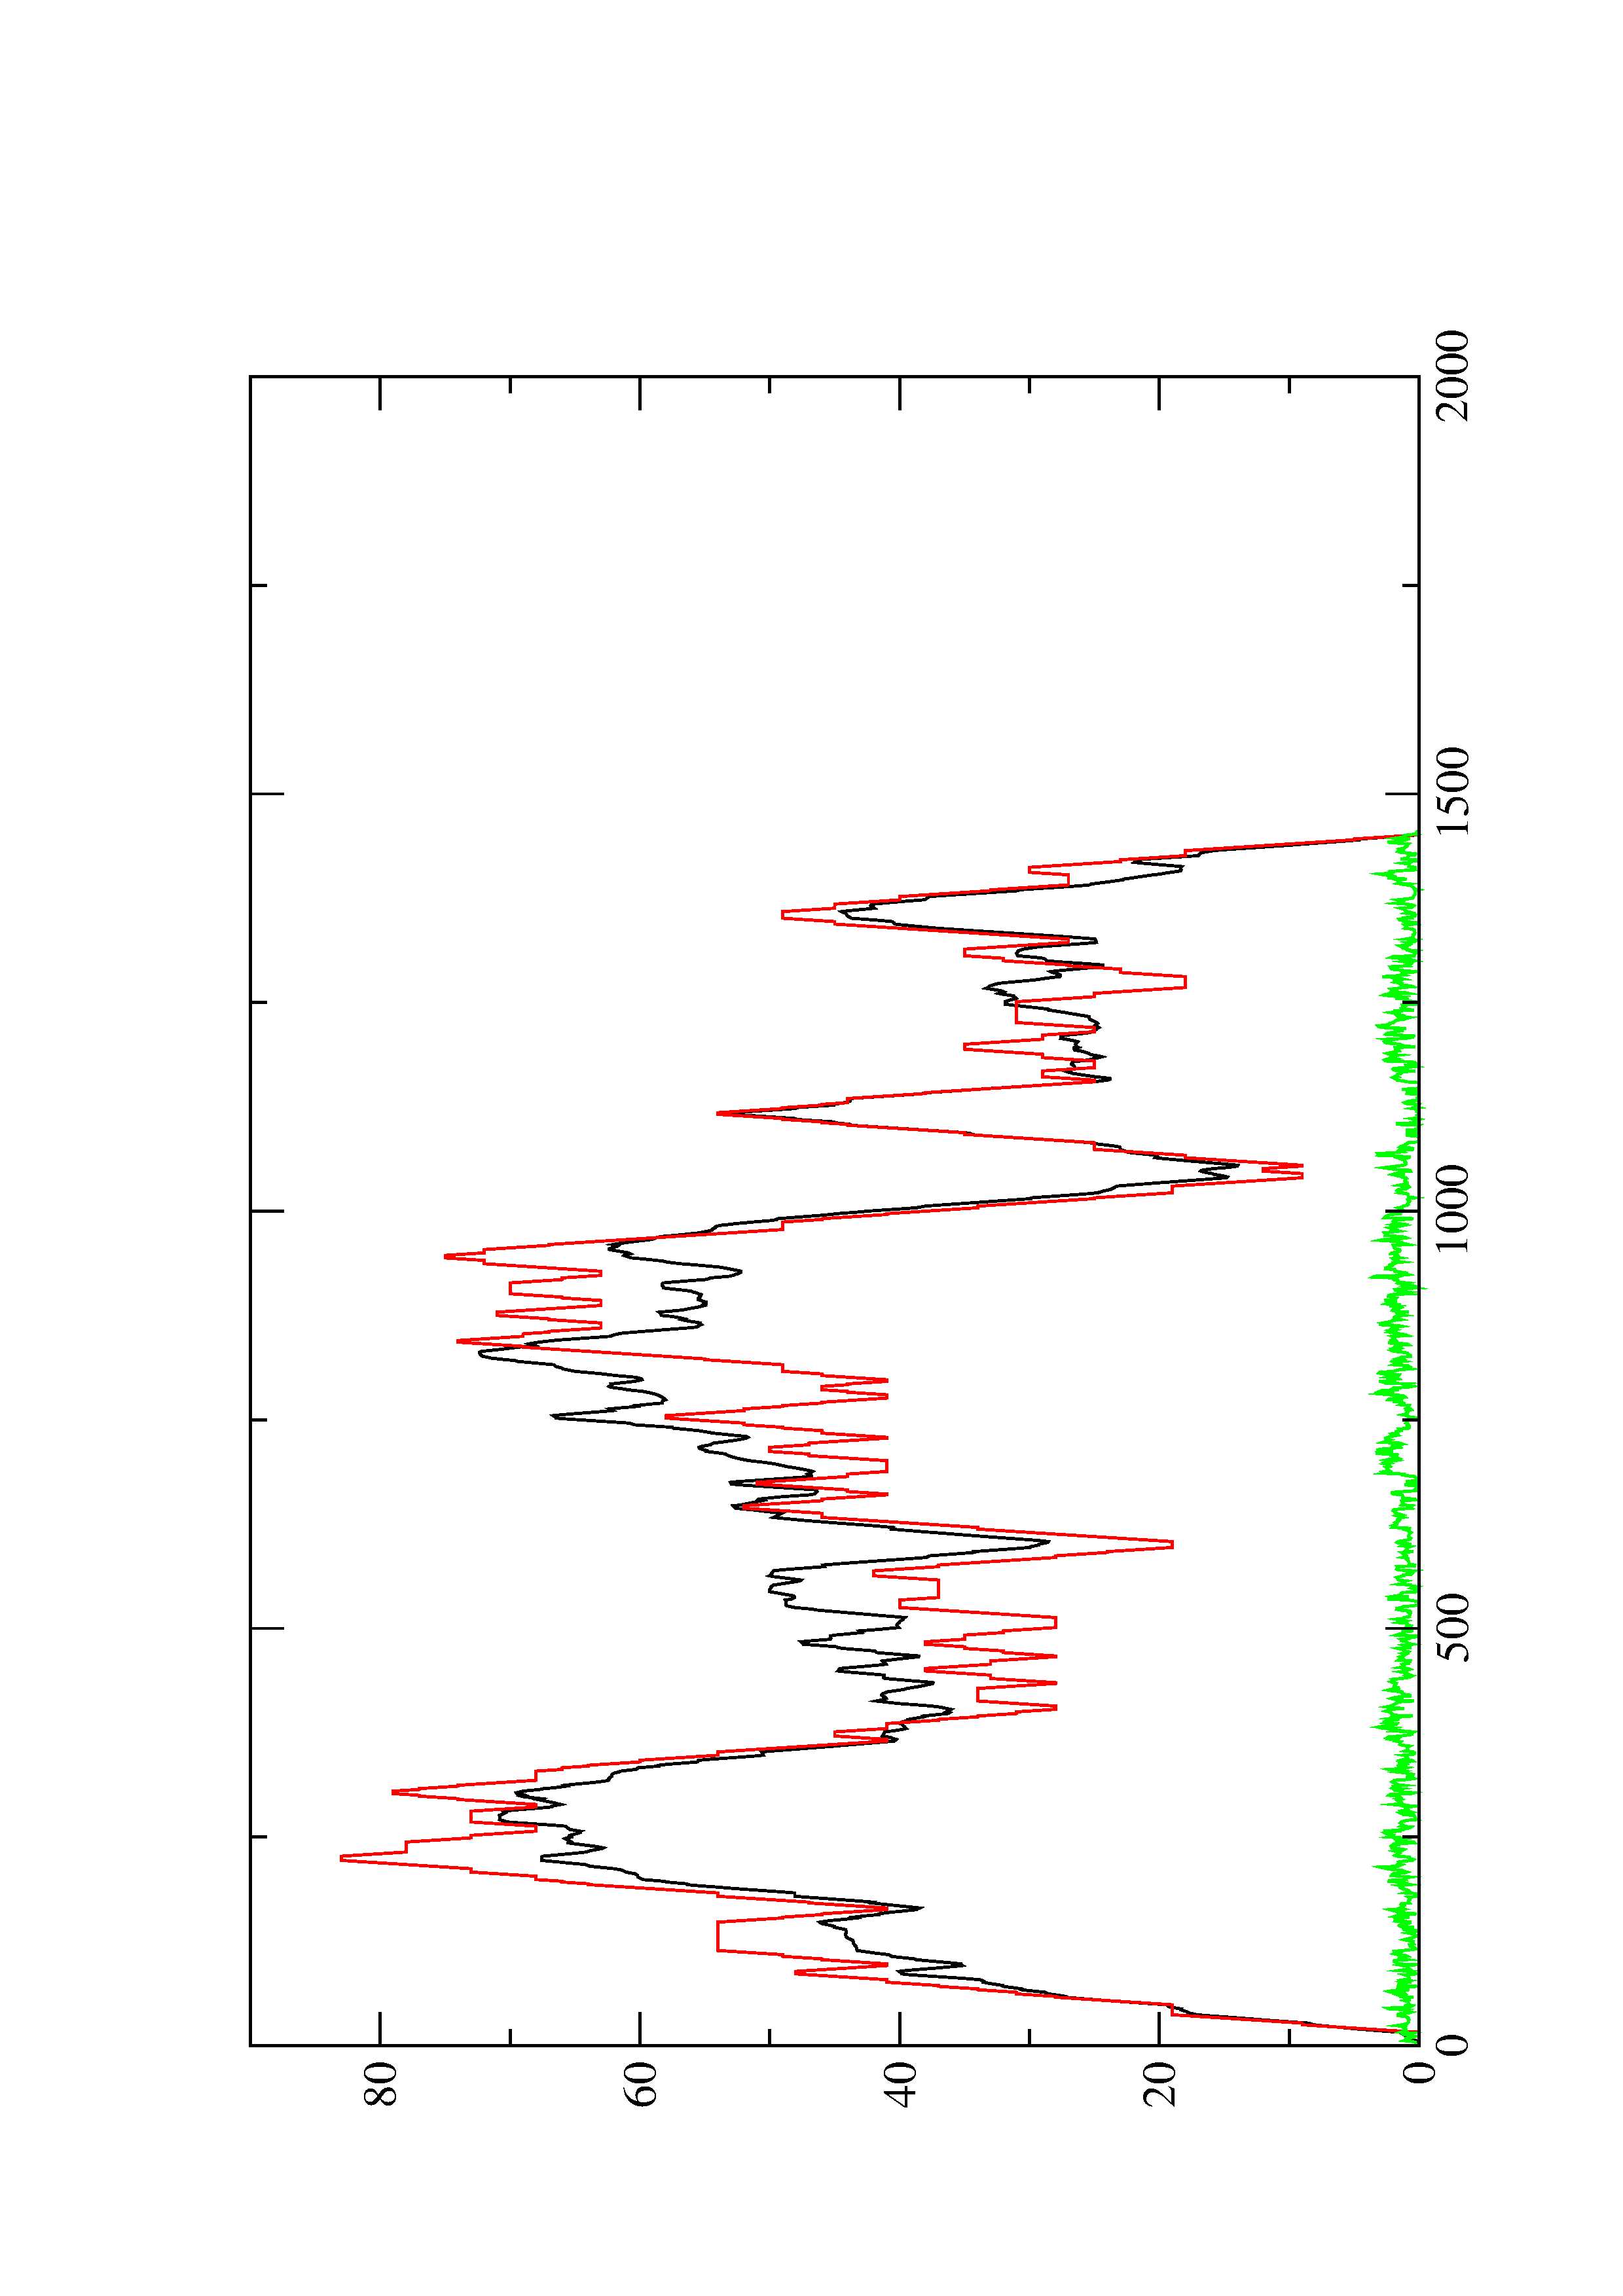
2. Here you find a mountain plot representation of the MFE structure, the thermodynamic ensemble of RNA structures, and the centroid structure. Additionally we present the positional entropy for each position. The resulting plot shows three curves, two mountain plots derived from the MFE structure (red) and the pairing probabilities (black) and a positional entropy curve (green). Well-defined regions are identified by low entropy.