lncRNA Structure Prediction
Species Name : Withania somnifera Sequence Id : GBHJ01017412.1
I. Result for minimum free energy prediction
The optimal secondary structure in dot-bracket notation with a minimum free energy of (-330.70) is given below.
1. Sequence-
UGUAGGGGCUCGUUUAUCUUUUUGUUUCAGCAAGGUAAAGUGCUCCAUAAGAAAUCUUUA
ACAAUUGGAUGUCUGAUGUUGGAAAUUGUUCAAAAAUGAUCCUGGUUGUGCUGCCACUCC
AUGAUCUUUGCGCUUCAGCAAGGUUUUAUGCCCUGAAGCUAGCGUCUGGUGGCUAUGAAU
GUUUUCGCUGCAGAUGAAGUUCAUAUAAAACUGUGAAUCAAAAGGUGGAUGCCCGCAAAU
UACUCCUAUUGCUUGUUACCAUUUCUUUGGUACACGAGUGGGCUGAAAUUUUCUAUUAAU
UUCUUGGAACAUCUACUUUAAAAAUUUAAUAAUCAAAAUACUCAAAUCUUUUAAAAUAUU
GCAUAUGAUGCCCCAUUUAUAACUCUGGGUACCUUUUUAUAACAAAUAUUCAGGCUUUUA
CUCUAGCAUGAUUUCUCAUCCAGGACUUCGAAAAUCAAACUUUUUUCUUUCUUCCCCCUC
UCCUCCUGCUUCCUCCUGCGGCCACCUCCCAAUUGCUACAUGCACCCCCUCAAAGCCAUC
CUGUUCCCAAAACAUGCAUUUUUUCACUGUCUUUUUUUUUUGGGCUUCAUUUCUUUCUCA
UUUUUGUUUGUUCUUUCCGGUUAAGUCUUUUAUUACUCUUCUUUAUUCUCUUUUCUUGUU
ACUUCAUUUUUGGUCUUGUUUUUCCUGUUAAAAUCUCCUUUUCAAUUUCUUUCUGUUCCU
UUUAUGUUCACUUCACAUUUUUUUUUCUUGUAAAAUCCCACUCUUUGCACUUUCUUUCUU
UCCCCUUUUUGUUUUGUUCGAUCAUUGUUAUCAAAGAAUGACCAUGCGAUUCUUUUUGGU
AAAUAAAACAUUUAUUACCAAAUGGAUCUACGUACAUACAAACUGCCAUCGGUUGGACCG
GAGCUCCAUCUGGCUAAAAUACCUACUCAAACCUCUACAAUACACUUAAAAUCAGACACA
AGAUGCAAGUAAUCCUUCUCAUUGCACAGAUCUCAUACUUGAUUUCCCGUUAGAUCCCAU
UUCACCAACUUUACCUUGUGUAUAUCCUAUUUGAAAGUACCAGGUUCAAGAUAUAUAGCC
AUUGAGGGGGUCUAAAGGUAUUGCAUGCCAGCUUCCUCGAUGAAAUUCUUAGGAUAUCUC
CUCUCAUCUUAUUAUAGAUCUUUUAGAUUGAGAAUUUCUCCAGUAGCAUCAGCCUUGGAU
CAUAAUGCCAGAACUCAGCAUAUACUGUUUUAGUUUUAAAGAUCUUGGUCGACAUCUAGG
AAAUCUUGUCUUGGUUCAUUAACCCACACGUCUUCCUUUAUUUGAUGAAUGGGUGGUGGU
GAUUGGGAGAGGAAAACCAGGUAUUGUGUUGAAGCUUUUAUGAGAUACCGAUUUUAUUGU
AAUUUUUGGGUGCAGCAAGCUGUAAUAUGUUUCUUCCAUCUUAGGGUAUAUGAUGCAGUU
GGCUAGUAGCUAUGAAAAGAUAACUCCACCUAAAGGCUAAAAGAAUUUCACUAAUCAAAA
UGAACUUUUUUGAUUAUGUUUGUACGAGUCACUUUCCUAAAAAUGCUUUUCUGGUGAUCG
ACUGGAGAGUGAUAUUGAAUUAUUUAUGAUUAUUUUUUGUG
2. MFE structure-
....(((((...((((((((.(((...))).))))))))..)))))(((((((((..((((((.((((....))))))))))((((.((((((....((((.(((..(((....))).))).)))).....(((((((...(((.....))))))))))((((....(((((......((.((((((((((((.....((
(((((......)))))))....((((((....(((((.............(((((((((((......))))).))))))(((..((((.............(((((((........(((((((((((................)))).)))))))(((((...((((((((((.............))))).....))))
)...)))))(((.(((........))).))).......)))))))....(((((........)))))))))..)))....................))))))))))).((((((((..((((.((((......(((....((((.(((((((..((((.....((..((((((........((((((((...........
..................((..(((........................)))..)).(((((((((((((..((((.(((((...(((...................................((((.......))))..........((((((.........))))))..................(((((..(((.((
.(((((.((....)).)))))......(((((..((((((((.((((...)))))))))))).)))))..)).))).)))))........((((((.(((((......))))))))....)))..................)))...))))).))))..)))))).)))))))..........(((((......((((((
(.(((((.......(((((..(((((((((((.....................)))))((((((..((((((........((((((((((.((...(((((...)))))))))))))))))((((((((((....((((......((((......)))).....))))))))))))))(((((.....((.(((..((((
(.(((.((.(((((............))))).)).)))..))))).))).))...)).))).)))))).))))))......(((((..((((...........))))..)))))..)))))).)))))..)))))..))))))))))))))))))))....))))))..))......))))..))))))).))))...))
).(((.(((.......))).))))))).))))..)))))))))).)))))...))))).))....))))).....))))..........(((((((((((.......))))))))).))........((((((((((.......(((.....)))........)))))))))).)))))).))))......)))))))))
.
You can download the minimum free energy (MFE) structure in
II. Results for thermodynamic ensemble prediction
1. The free energy of the thermodynamic ensemble is [-360.01] kcal/mol.
2. The frequency of mfe structure in ensemble 2.21532e-21.
3. The ensemble diversity 316.37.
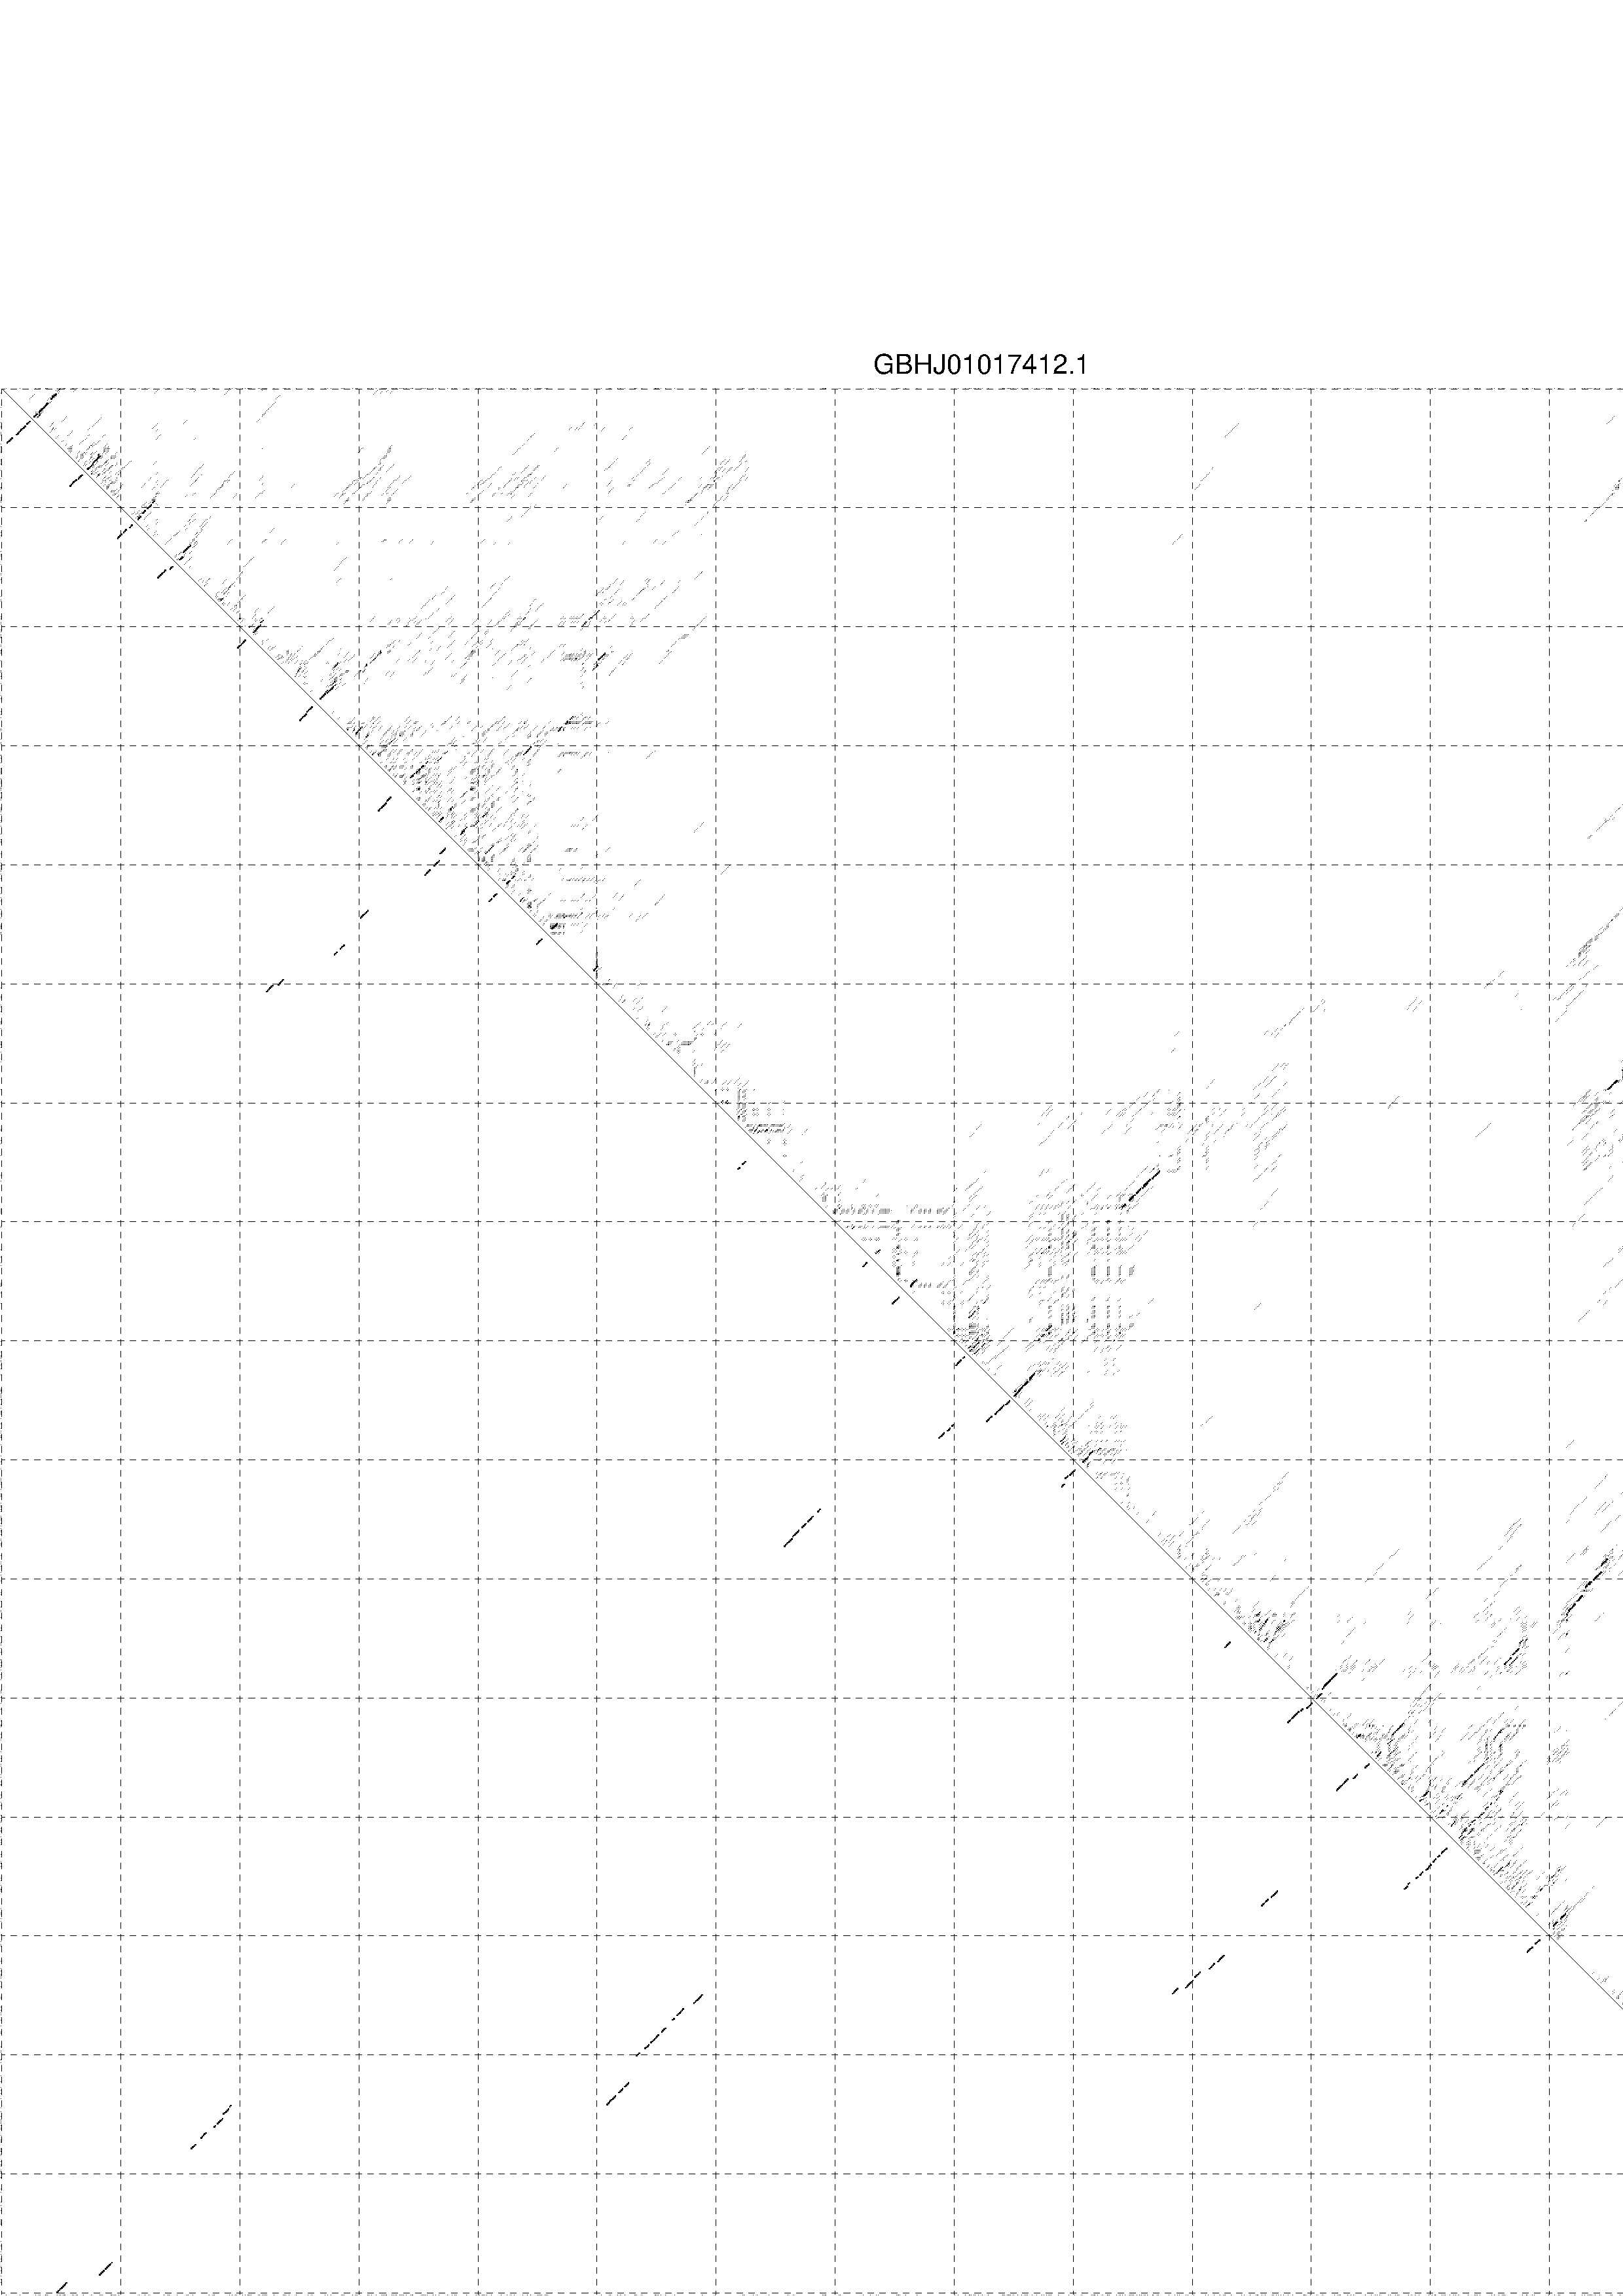
4. You may look at the dot plot containing the base pair probabilities [below]
III. Graphical output
1. A note on base-pairing probabilities:--
The structure below is colored by base-pairing probabilities. For unpaired regions the color denotes the probability of being unpaired. The reliability information of RNA secondary structure
plot in the form of color annotation, Positional entropy ranging from red (low entropy, well-defined) via green to blue and
violet (high entropy, ill-defined).

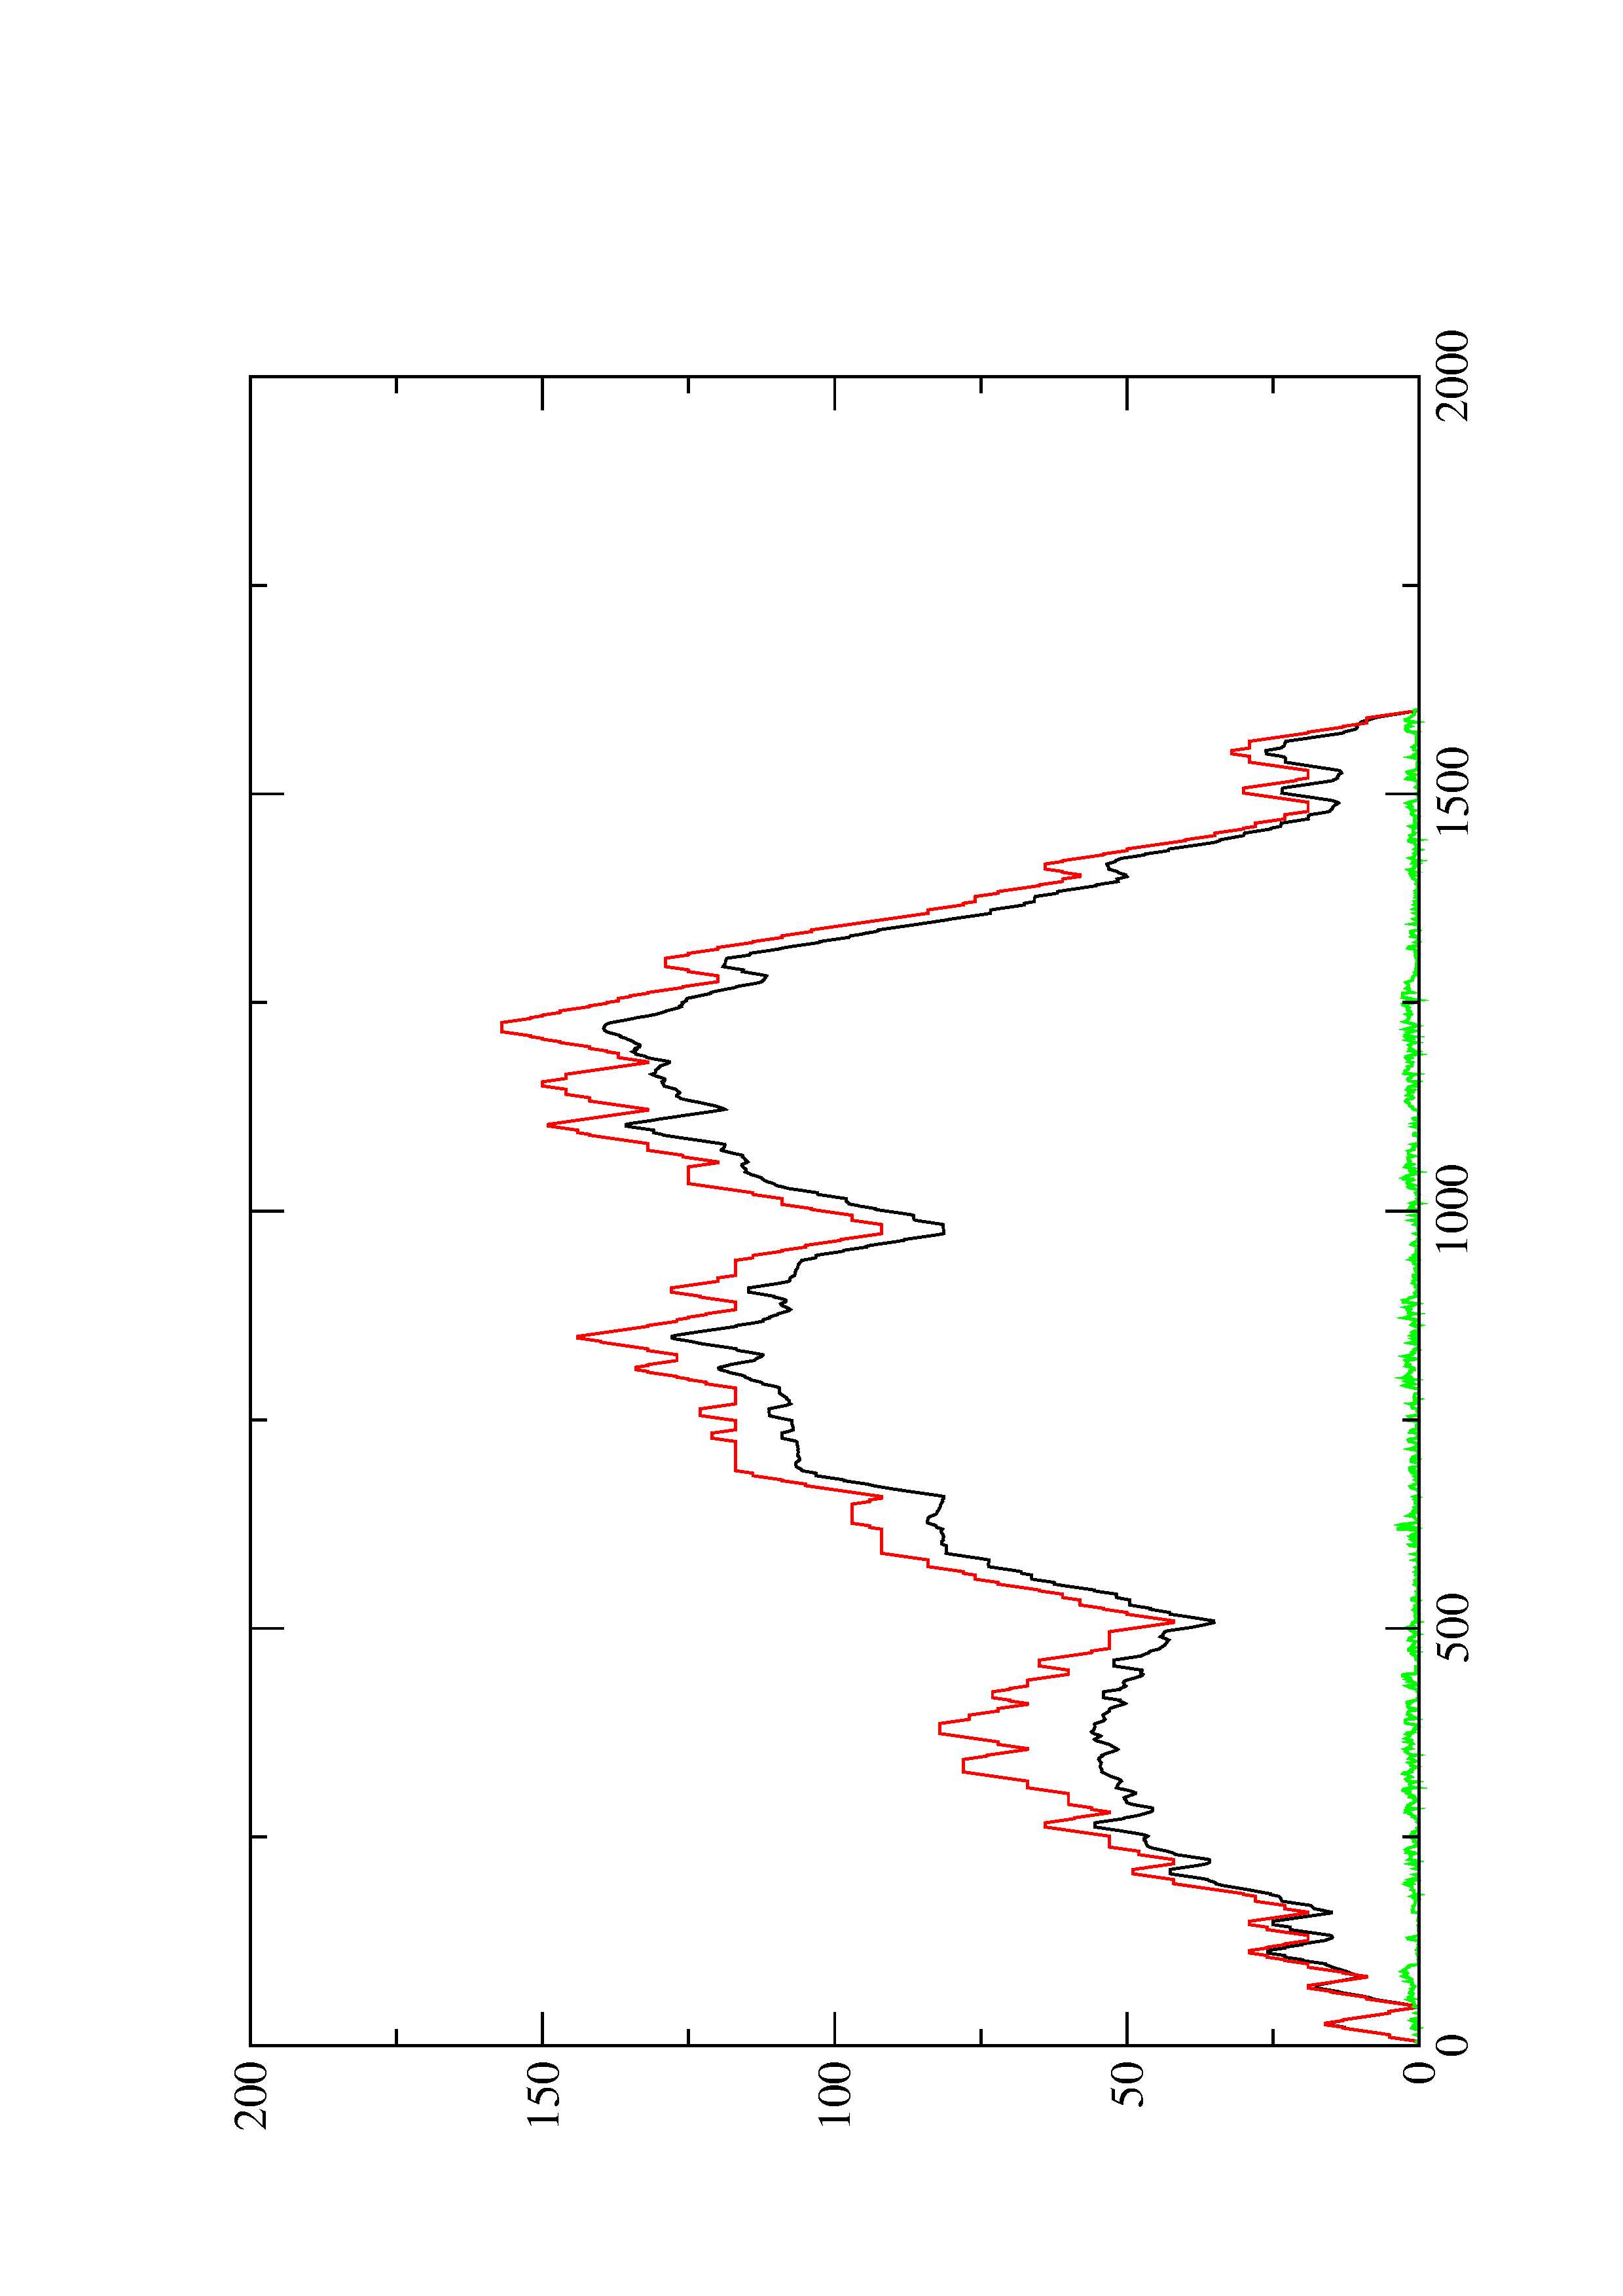
2. Here you find a mountain plot representation of the MFE structure, the thermodynamic ensemble of RNA structures, and the centroid structure. Additionally we present the positional entropy for each position. The resulting plot shows three curves, two mountain plots derived from the MFE structure (red) and the pairing probabilities (black) and a positional entropy curve (green). Well-defined regions are identified by low entropy.