lncRNA Structure Prediction
Species Name : Withania somnifera Sequence Id : GBHJ01021992.1
I. Result for minimum free energy prediction
The optimal secondary structure in dot-bracket notation with a minimum free energy of (-397.00) is given below.
1. Sequence-
GACAAAUCUGUUUUUAAGGAUAGCCAUAGAUUAUAAUCAAUACUUUUAGAUUCUCUGUUA
CUUCUUUUAUGGAUCAGAACCUGCUCAUGGAACAAGAAAUAAGUUUAAGCACAUACUUGA
ACAACAGUUACUGAGCAUUUCUUCCUAAUUUAGUUUUAGCGAAGUUAUUUAGGAGCUAUC
GCAAAGAAAACAAAUUAAGAACAUACUUGUAGCUUAUGCUAUGCUUAUUUUUAAGUAUUA
UGUCAACUGAAUUAAGUUAUGGUCAUUGCUUACCUGUGUAAUUGUUCCGUGUAGCCUUUC
CAUCCACUAAGGAAACUAUUGUAUAAGAUUAUCGUAACAGAUAUCUAACUCUAAUCUUUU
GUUGAAAAUAAAUGUUUCAAUAUUAUCUGACUAAAUUCAAAUUAGUUUAUGGUUUUUAAU
CUAACUAAACUGUUAAACGUACAAUCCACAUAUAUUUUCAAAAAAAUUGGGACCUUUUUC
CUUUGGUUGCAUAUAUGAGGUGCAAAAUUAUGAUUGUAUUCAAGAUUUGGCUUCAUUAUC
AUGGUGACAACAUUAUGAAAUGAUAACAAAACCAAAUCUUAGUACUUCCAUGAUGUGGGA
UUAAACGCUUUAUUCAAUGAGAAUUAUCAUGGGCGACCCCAAGCUUUUUGGGUAACUGUA
GCUUCAUCUUGGUGCUUAAUGUACGAGCAUUUGCUGUUAUGCUUAACUGCGUUGAUAAGC
AUUGCAUCUAUAUAUUGAGCUGCAAUCUAUUCUAUUCACCCUUAUGGGAUGUAAGAUUUG
CUGAUGCUCAGAAAUGUGUUUCUUGGCUGAGUGAGAUAUUGGACACGUUUAUAGUGUACA
UCUUGUGCCAACUUUGUGCAAUCAUACUCGCAGUCUGCCACUUUGUGCCAAUAUACUAGG
UUUGUUGUUGUGGUUGAUCCAGACAUAUAGGCAGGUGUCUACCACAGUCAUUGUUGUGCU
GACCGUUGAAUGUCUGGAAUAGUAAACAUUGGUUCUUCGUUGCCCAAUAGUUCAUUUGGU
GACUAUUUGAGCUACAUCAGAACCGUAUAUCUUUUAUCUGAGAUAGUAUGCGGUAAUACU
CCUUGGUGUCAUUCACAGGUUGUUGUCAUAGUAAAUGGGGACUUACAAGGUCAAUAAUAG
CUAGUAUUUACAUUGCUUACCCAUACUUAAGGCCAGGUGUUCUUCCAGUGAUUGUUGUUC
UGACCGUUGAAUUUCUGAAAUAGUGAAUAGUGGUUCUACUUGCAUGAUAGUUCAGUUGGU
GACUAUUGGAGCUACAUCAGAAUCUCCCAUUUAUCUGACAGGUUGCUCUCUGUUUAGGCC
UUUGCUUCUCGUUCACAAAUCUCCAUGAACCUUUGUAUACUGGGAACAUUUUCAUCUGAG
AUGUUGUGGACGAUUACUUCUUUGCCAAAGACAUUGUUCGUUGUAAGAUCGUCAUUGUUG
CAGACUUGUCAAAAGGAGAAGUUAUUGAUGCUGCUGUUUUUCUCAUAUAUAUUAAAAAAU
CGAGAUGGCCCAUCAAUGUUACAUUGUUGUAAAGGCUUUUGAUUAUACAAUGUAAAUAUG
CUUUUCAUAUAACAAGUUUAUGUGUUCUGUUUGAGUAUACUAAUUUGUUGAUGAG
2. MFE structure-
((((....))))...(((.(((...(((...(((((((((.....((((((..((((((((((((((..(((((..(((...(((((((((((((.......(((((((......))))))).((((....((((((......(((((((((((((..((((((((.......)))).))))..................
(((....)))(((....)))(((((((....)))))))..........))))))))))).))....)))))).))))....)))))))))).)))..))).)))))..))))))((....))...........)))))))).))))))...........((((((((.......))))))))...(((((..........
..(((((..(((((........)))))))))).(((((((..(((((.(((.................((((......))))....((((((.......)))))).((((((...(((((.(((((((((..(((((.((((((((....)))))))))))))........))))))))))))))...))))))))))))
))..))).))))....((((......))))((((((((((((.....)))))((((((((((..((.((((((((((((((((.(((((..(((((((((((......))).)))).)))).))).))..)))))))))).((((((((((((((........)))))))...))).)))).((.((.((....)).)).
)).((((.(((((((((((((.(((.(((......(((((...))))).)))..))).)))).)).)))))..)).))))..............))))))..))..)))))))))).(((((((((...(((.(((...(((.(((.....))).)))...))))))..)))))))))....................))
)))))..(((((((..(((...)))..)))))))..)))))((((((((((((......))))...)))))))).(((((....))))).....(((((..(((((((..((((((((((.....((((((((..((((((.(((.....(((((.......((((((......)))))).....)))))))))))))).
))))).)))...((((((..((((...((((((((..(((.((.(((....))))).)))))))))))..))))..))))))..)))))))))).)))))....))..)))))..((((((((((...(((((((((((((((.((((((((.........)))......)))))..))))).))))))))))..(((((
(((......((((..(((...(((((...........)))))))).))))....))))))))((((((((..((((((((.....................)))))))).))))))))..........)))))))))))))))))))...)))...))).))).((((.(((((((((..(((((((.....))))))).
.))))))))))))).
You can download the minimum free energy (MFE) structure in
II. Results for thermodynamic ensemble prediction
1. The free energy of the thermodynamic ensemble is [-428.70] kcal/mol.
2. The frequency of mfe structure in ensemble 4.61726e-23.
3. The ensemble diversity 358.96.
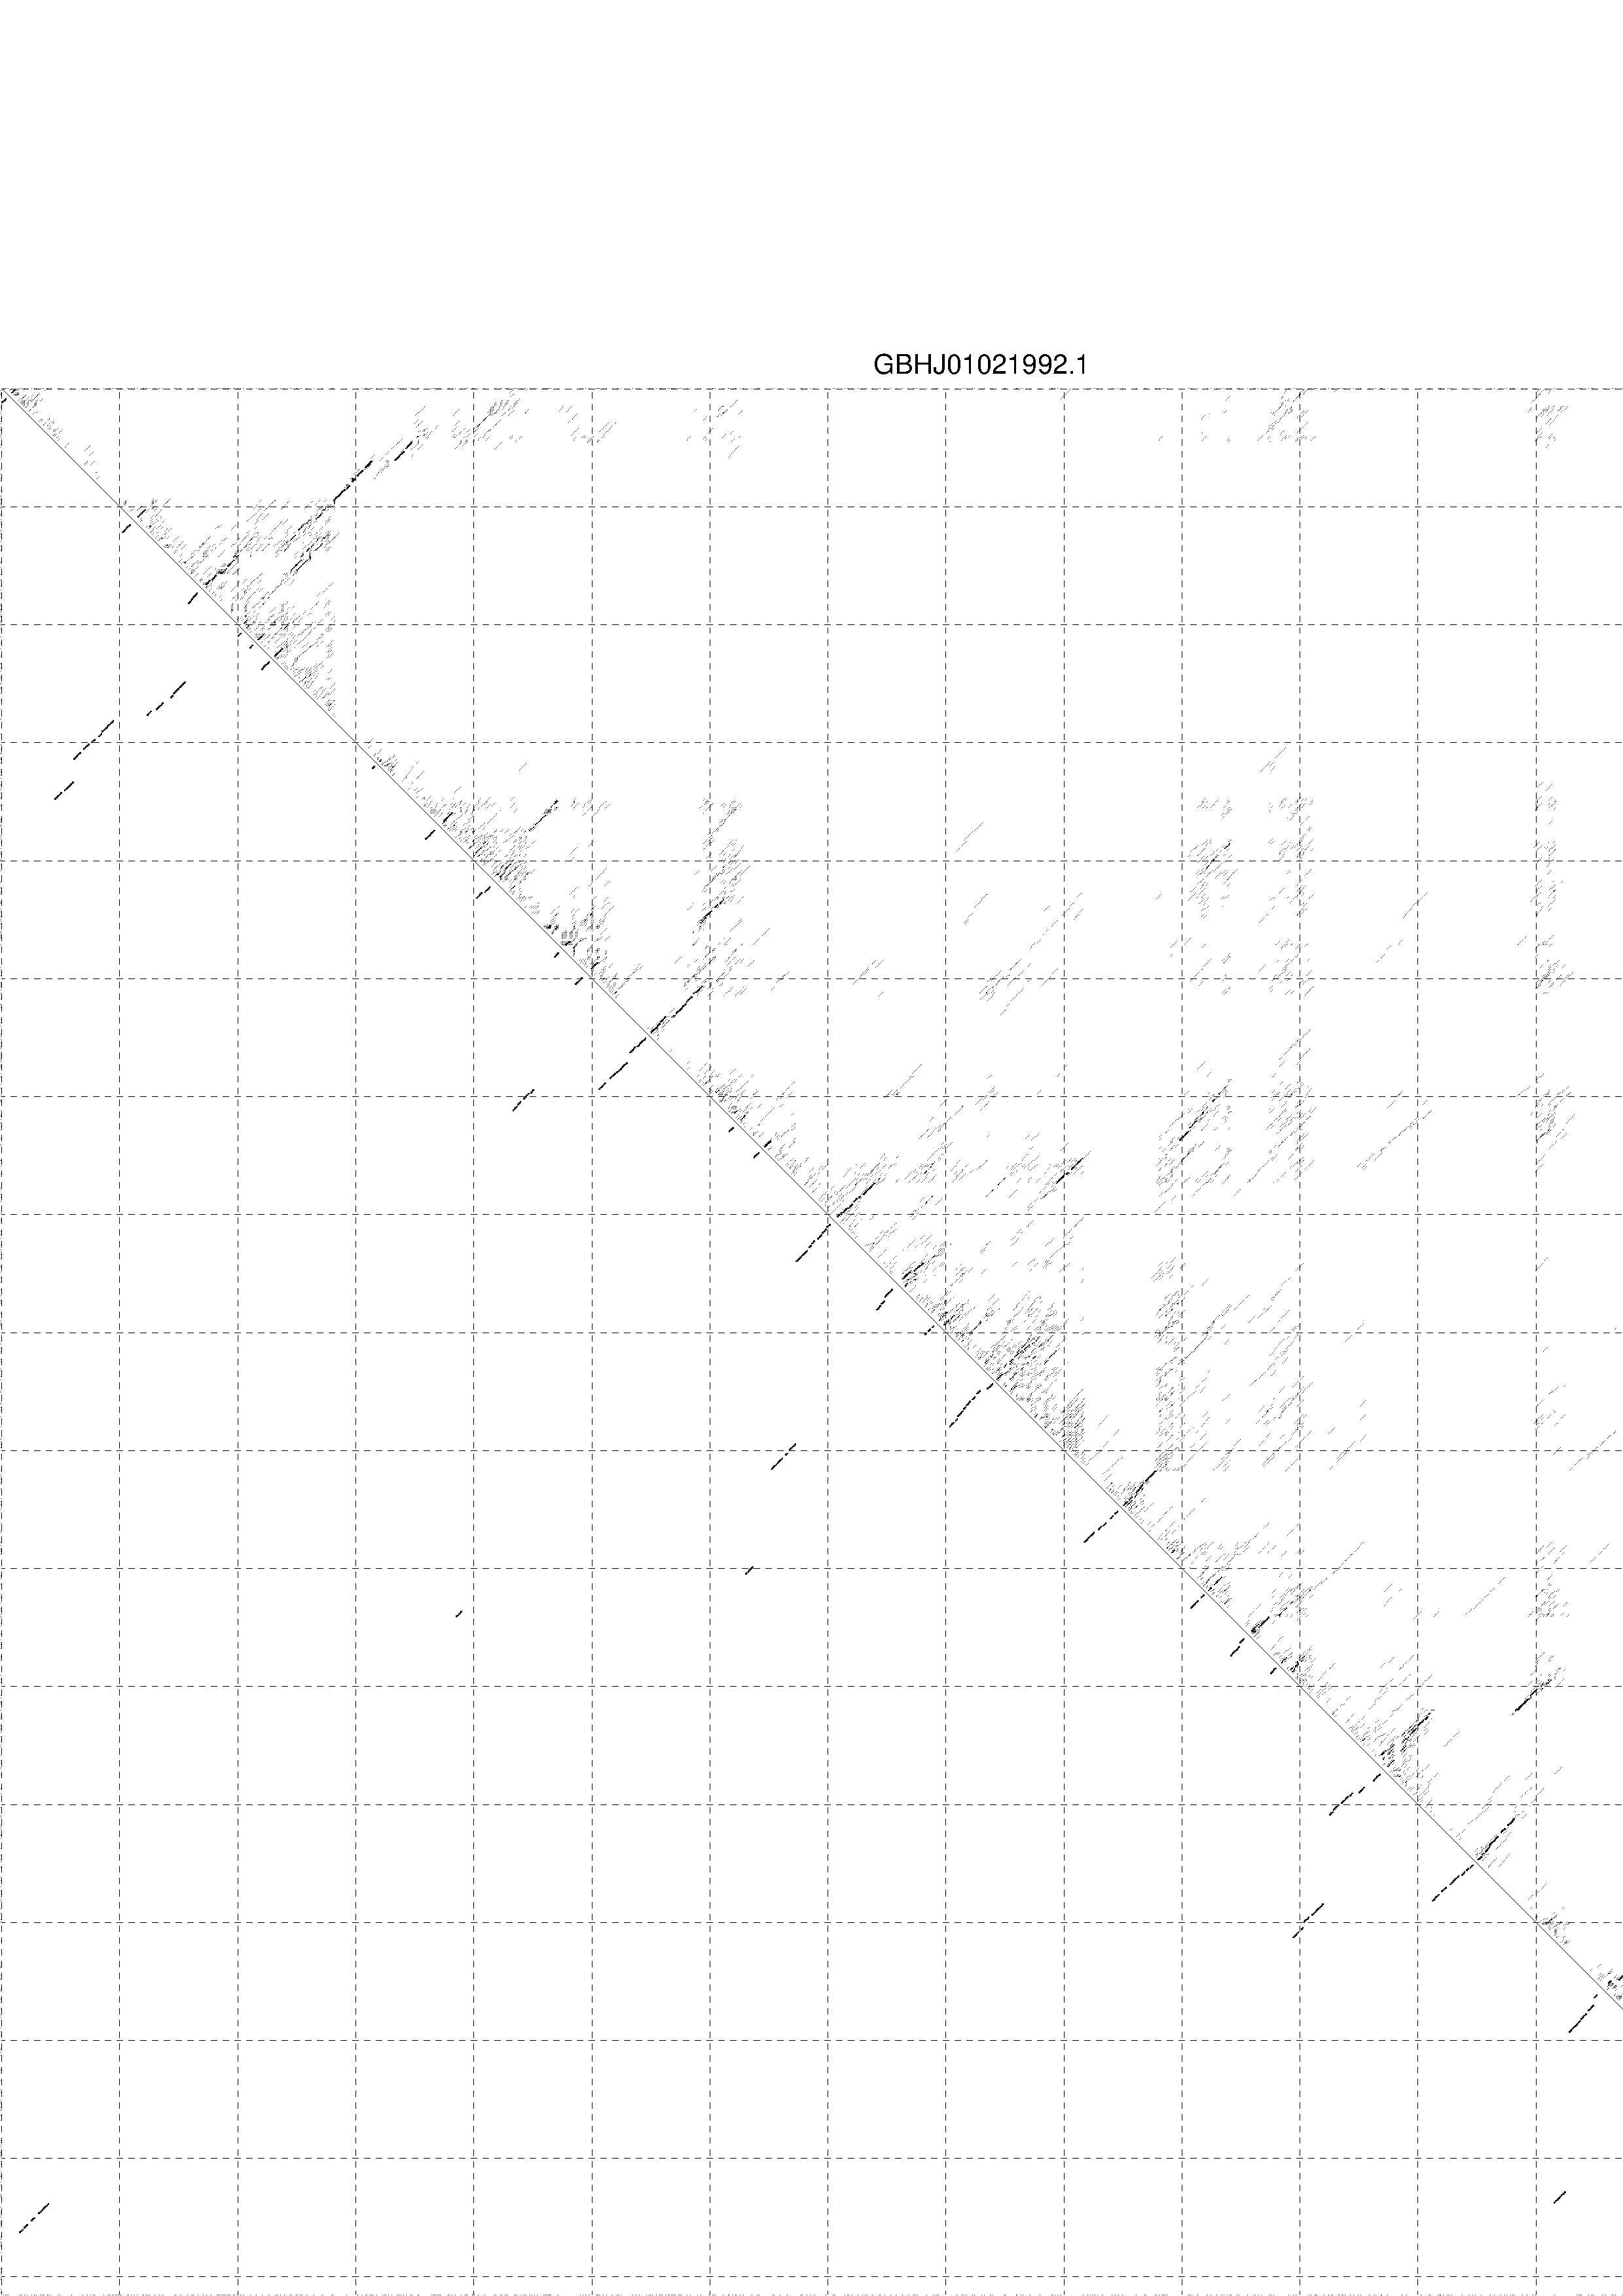
4. You may look at the dot plot containing the base pair probabilities [below]
III. Graphical output
1. A note on base-pairing probabilities:--
The structure below is colored by base-pairing probabilities. For unpaired regions the color denotes the probability of being unpaired. The reliability information of RNA secondary structure
plot in the form of color annotation, Positional entropy ranging from red (low entropy, well-defined) via green to blue and
violet (high entropy, ill-defined).

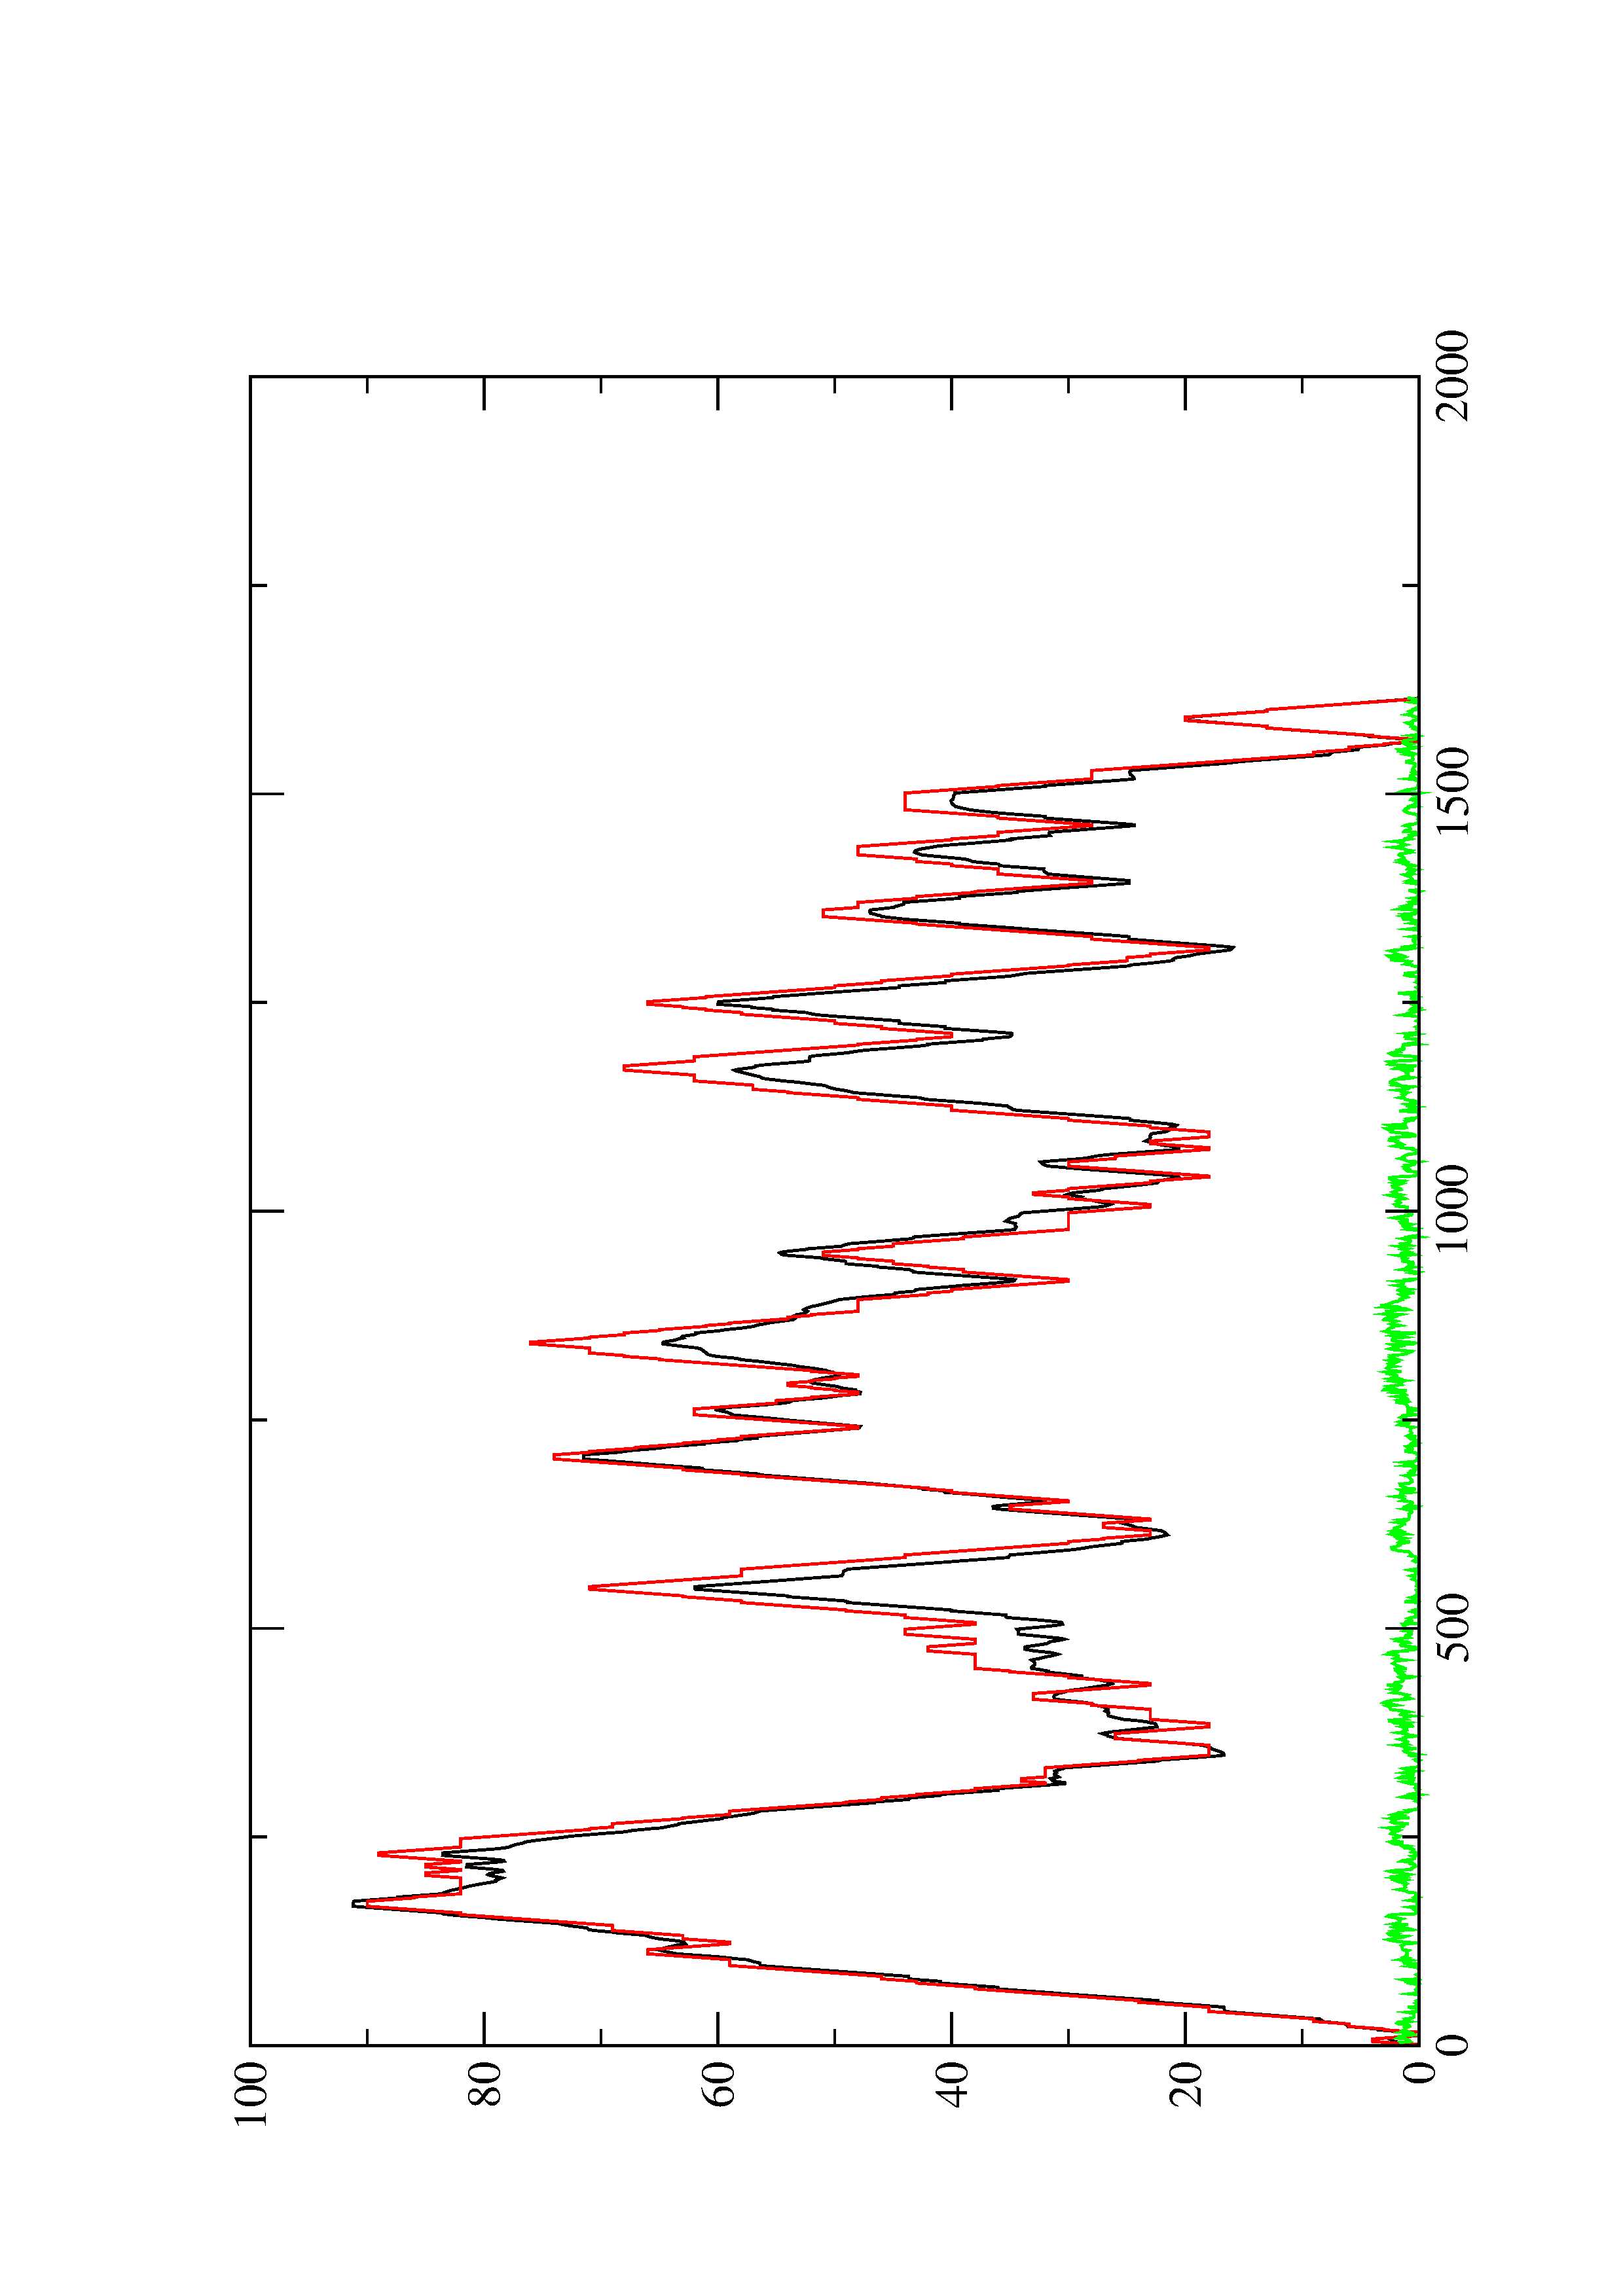
2. Here you find a mountain plot representation of the MFE structure, the thermodynamic ensemble of RNA structures, and the centroid structure. Additionally we present the positional entropy for each position. The resulting plot shows three curves, two mountain plots derived from the MFE structure (red) and the pairing probabilities (black) and a positional entropy curve (green). Well-defined regions are identified by low entropy.