lncRNA Structure Prediction
Species Name : Withania somnifera Sequence Id : GBHJ01031777.1
I. Result for minimum free energy prediction
The optimal secondary structure in dot-bracket notation with a minimum free energy of (-280.00) is given below.
1. Sequence-
UUUUUUUCGAAGAAAUCUAUGAUUUUUAUUUGAAAACAUCCACGAGAAUGAGUUCUCCUA
AACCAGCAUACACCAUAAUUCUAUAUAAAAGCAUAAUAAAGGUACAAGAAUAUAAAGAAG
GAGAAGGAAGAAGAGAGAGUAUCAUAGGCCAUCCAGGCCCAAACUUCCAAGAAGAAUGCA
GAUGGGUUUGAAAUCCAUGAAACAGUAGAGAGGUCACUGGGAACAUGCAAAAAAAAUUAU
CGAGUAAAUUAAUUAGAAAUCGCAUAAGAAAUAACCGAAAUAAGGAUACCAAAGAAAGAA
AUAUUUAUUUAAGGCAUUGCUGAUAUAUACAGUAAUAAUUACAUACAACUAAUGGGCCAA
GCCCAGUGCAUAUAAAUCAAUCCCAAAGUAUCCAGCACAAAGCACAAAUGACAAUUACAA
UAAAAGUGGUUAAUAAAGAAAGACAUUGAUCCAUAAUCCCAUUAUGUUAAAAUCAAGACU
CCAUAUUAUGGGGCAUGGGGAUACGGGAUGAUACAGGAAACAUAUAGUAUUAAAACAGUU
GGCUACAAGAACAUUUAUGCUCCAUAUAAACCAACAUUUCAUACAACAGGAUUGAUGCUA
GAUAGCACCUCAACUAGGAUGAAGAGUCAUAUUAGCAAGUAGCGCAACCAUAUAGAGUAA
AGGUUGUCAAUAGUUUAGUCAUGUUAUACAAGUGUAGACAAUAAGAAAUUAGUGAUGAUG
CCAGAUUAAAGGUUCAAUUUUGGGCAUGAAUGAGAAGGAUGAGACAACUGAAAUAUAUUU
UAAUCAUGUUGGAGGUAAACGAAAGGUAGUUAUGGACUAGAUAGAAACAAUAUGCAGGGU
UGGGGGUUCAGGCAUUGCACCAGAGGAAGGGCAAACAUUUAUAACUCUAAAAUAGAAGGG
AAGCAAGAAUGCAUACAAAGCAGACACACAUCCAUAAGAGAUUAAGACAACCUUGGGUAC
AUUAAAACAAAUGAAACCAAUAUACCAAAUAUAAUAUACUUGUAGAACUAAGAAUUAAUA
AAAAUAAUUCUACAAUACCCAUCUAAACUUGAUUCUUGUGAUUACAAUAACGAAAGACGG
ACUUAUUAGUGAAGUCUAAAUGAAAAGAUGAGCAGAUAUCAUAGCAGAGAGAAGGGACUU
GCUAAGAAGAUUUCAUUAAUUUCAUAGACUCAAAACAGUCAUAUUAACGCAUAAUAGUUC
CAACAACACACUUAUAUCAGGAUAUGAAUCAAACAGUCAUGGAAACCAUACACAUAGUCA
AUGUUUCAAGGAUGAAUAGCAUGCCAAGGACAGUUAAAUUAUAUGAAAAUGAGGGAGAUA
UCUAAACCUAUCGUUAUGCAUUUCUUUUGAUCUAAUUUCAAUAGCUGACUACUCAAGAUA
UGGUACCAGGUCGAGAAACUAUAACAACAAUUAUACAAGGGCAAUGGUCAACUUCAAUCC
AUCAACUAAGUAUGCAGUAGAUUGGUUGACAGAAACAAGAAUGUAGUCAAAUCAUGUUAU
AACAUAUUAGAGCAUACAUGACACCUUAGCCUUCUAAUCACAAAAGGUACAACAAAUAAC
CGGUAAAUAUCUUCUAAUUACCAUACAGAGUUAUUUAGUUCA
2. MFE structure-
...((((((((((((((...))))))..)))))))).......(((((....))))).................((((((((.(((...............((((..........((((((..((((.......((.....))...((((((....((((...((((...)))).(((((..((((((((...(((((..
..((((.((....)))))).....((((......(((((..........))))).......)))).........((.(((((((...................)))))))..)).(((((((.......)))))))...............))))).)))))))).)))))........(((((...((((((.((....
.)).........((((((.......))))))...................((((..((((((.((((...............)))).)))))).)))))))))))))))(((((............)))))......(((((((((.........(((((((...............(((((......((.((((((((.
...))))..))))))...)))))))).)))).......))))).))))........((((..(((((..((((((((((((.(((((..((((.(((((((.(((((((..((((((((.(((((((...(((((((((((.(((((((.(((((...((............))...))))).))))))).)))))....
..(((((.(((.(((((((.........((((((....(((..(((((......((((.((.......))))))..........((((........))))..(((....)))....................((((((((.(((((.......((((((((((......))))..........................(
(((((((....................))))))))))))))......)))))))))))))..............((((..(((....)))...))))..((((((.(((((...(((.((.(((((.((........))))))).))..))))))))..)))))).)))))..)))...)))))).........))).))
))..))))).)))...........))))))....)))).)))....(((.((.(((((...(((((...(((((.....))).))..))))).....))))).))...)))(((............)))))))))))..)))))))))).))))))))..)))))))))).(((..(((.((....)).)))))))))))
)).)))))..))))....)))).))))))..((((((((.(((.(((........))).))).)))))).))..(((....))).((((....(((((.(((....))).)))))...)))).))))..))))))...........))))...........(((((.((.....)).)))))))).))))))))......
..
You can download the minimum free energy (MFE) structure in
II. Results for thermodynamic ensemble prediction
1. The free energy of the thermodynamic ensemble is [-309.99] kcal/mol.
2. The frequency of mfe structure in ensemble 7.34612e-22.
3. The ensemble diversity 439.65.
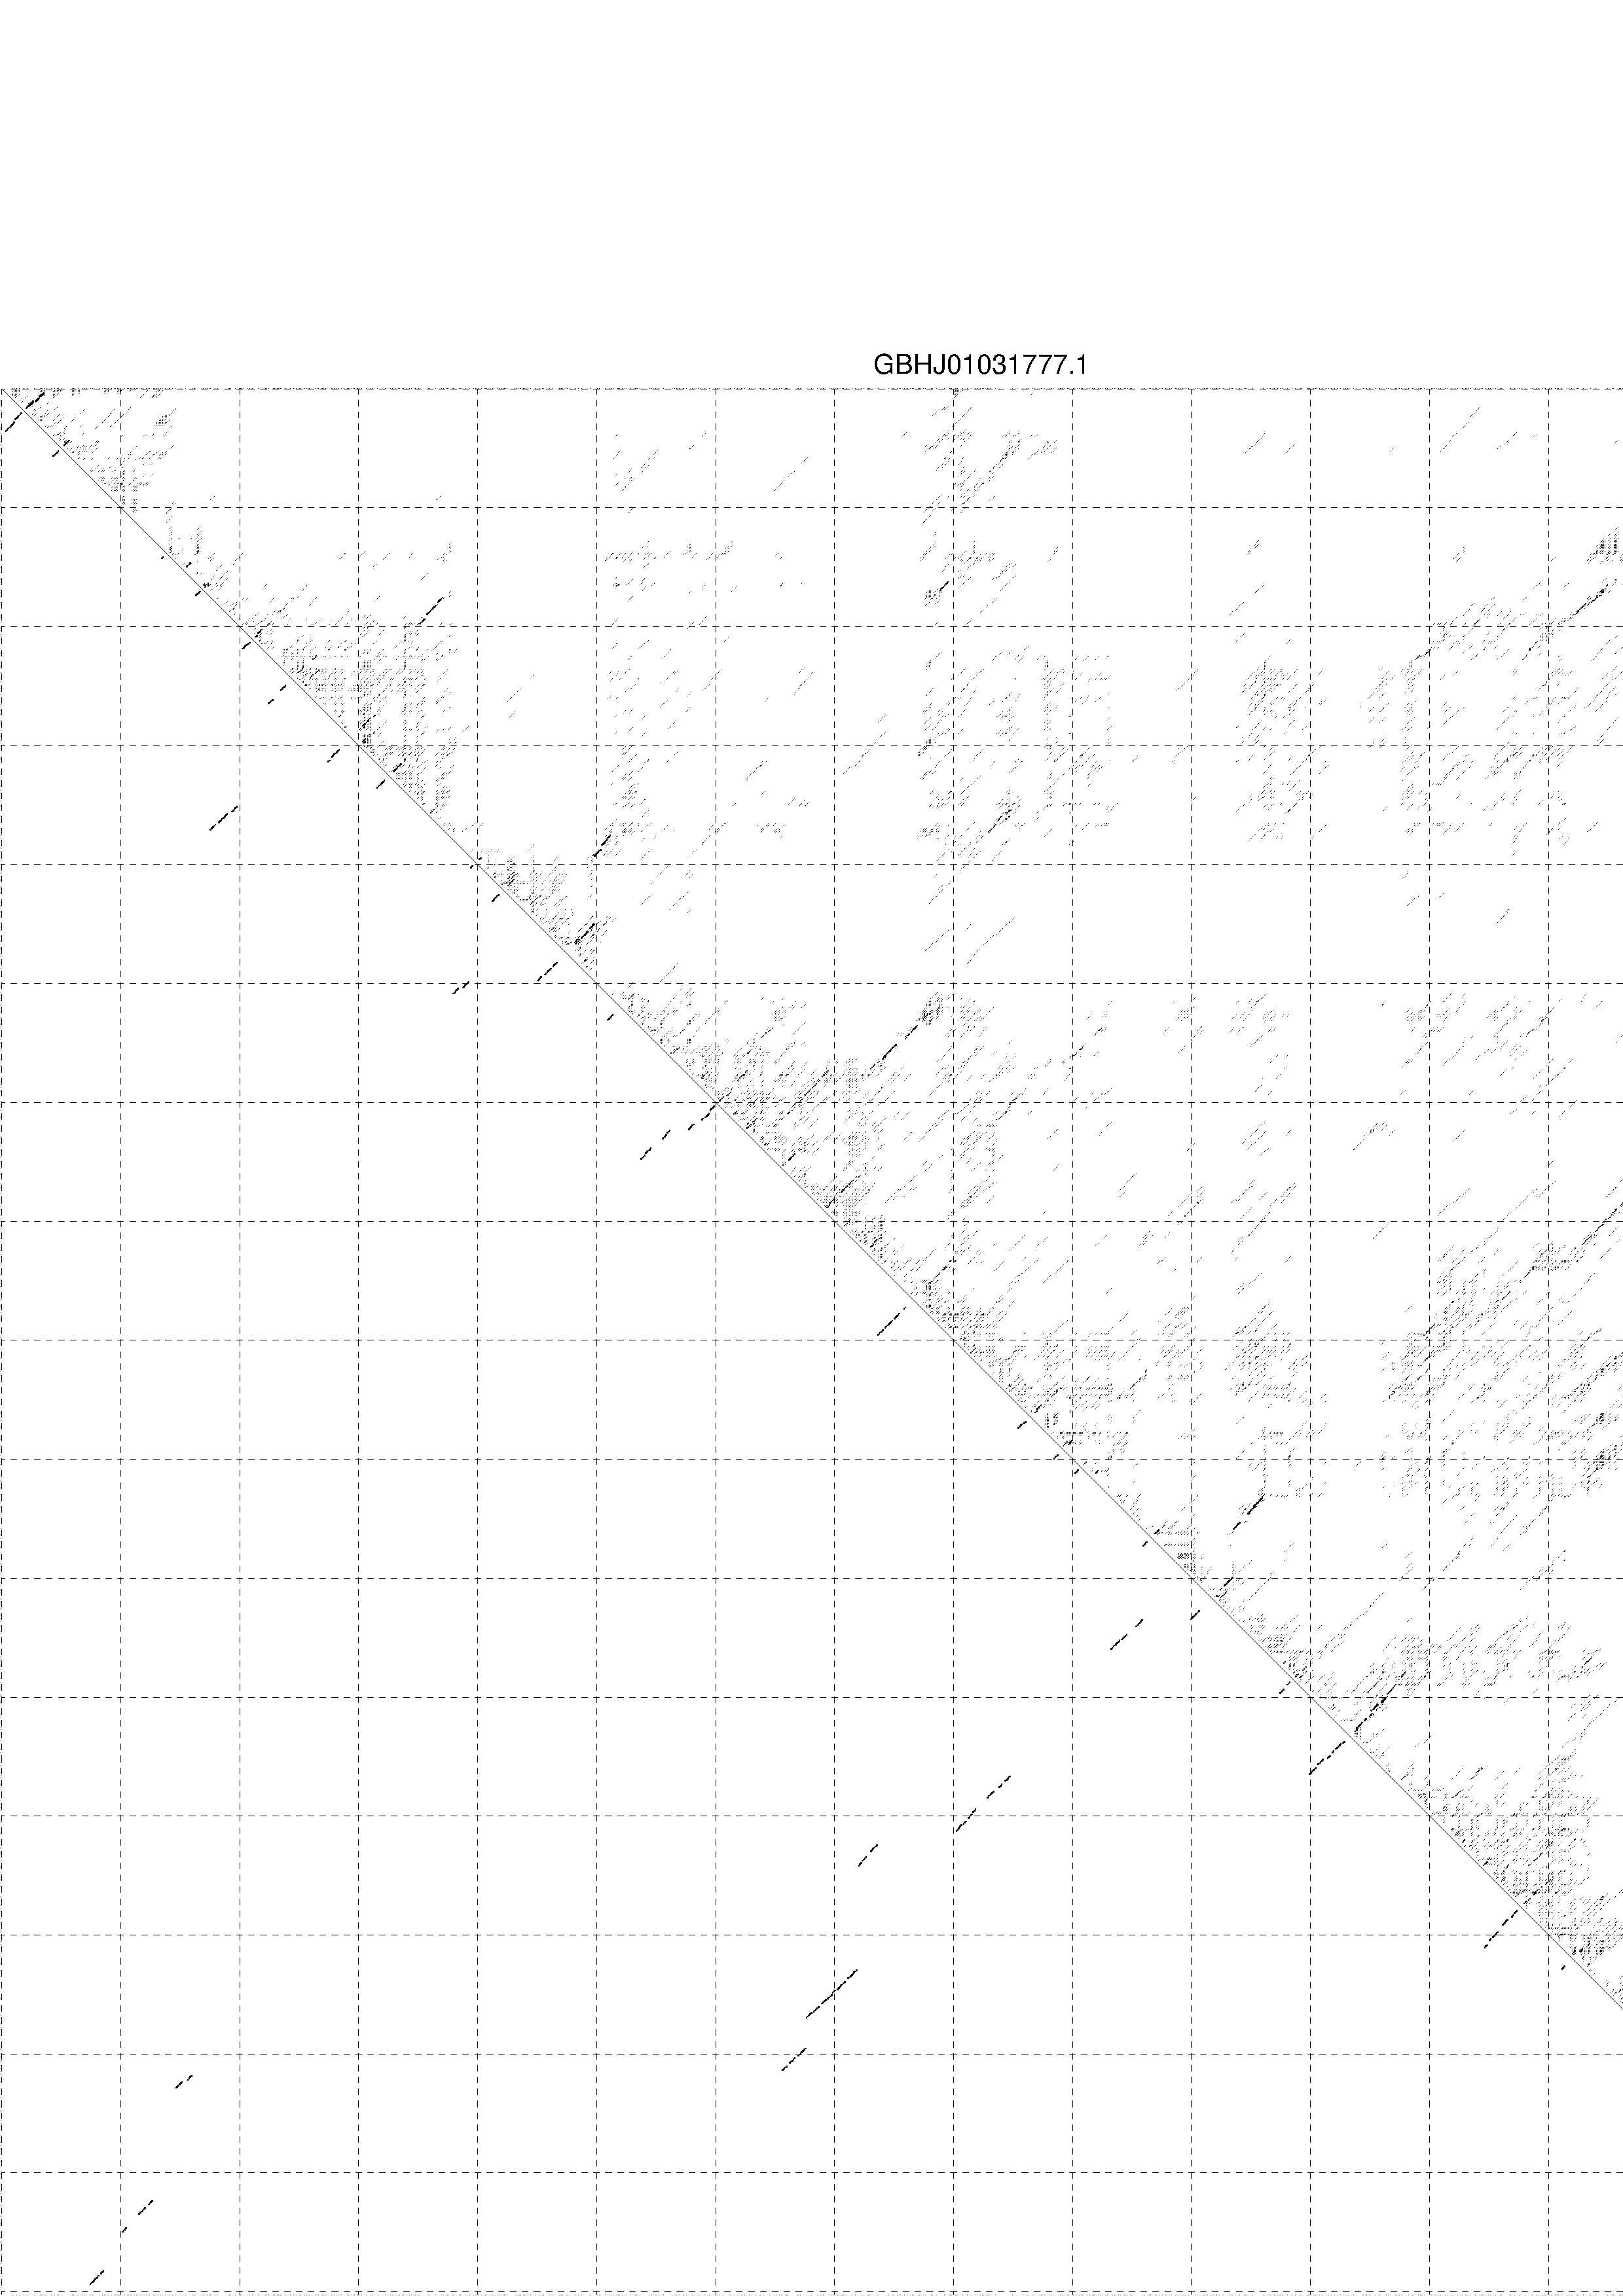
4. You may look at the dot plot containing the base pair probabilities [below]
III. Graphical output
1. A note on base-pairing probabilities:--
The structure below is colored by base-pairing probabilities. For unpaired regions the color denotes the probability of being unpaired. The reliability information of RNA secondary structure
plot in the form of color annotation, Positional entropy ranging from red (low entropy, well-defined) via green to blue and
violet (high entropy, ill-defined).

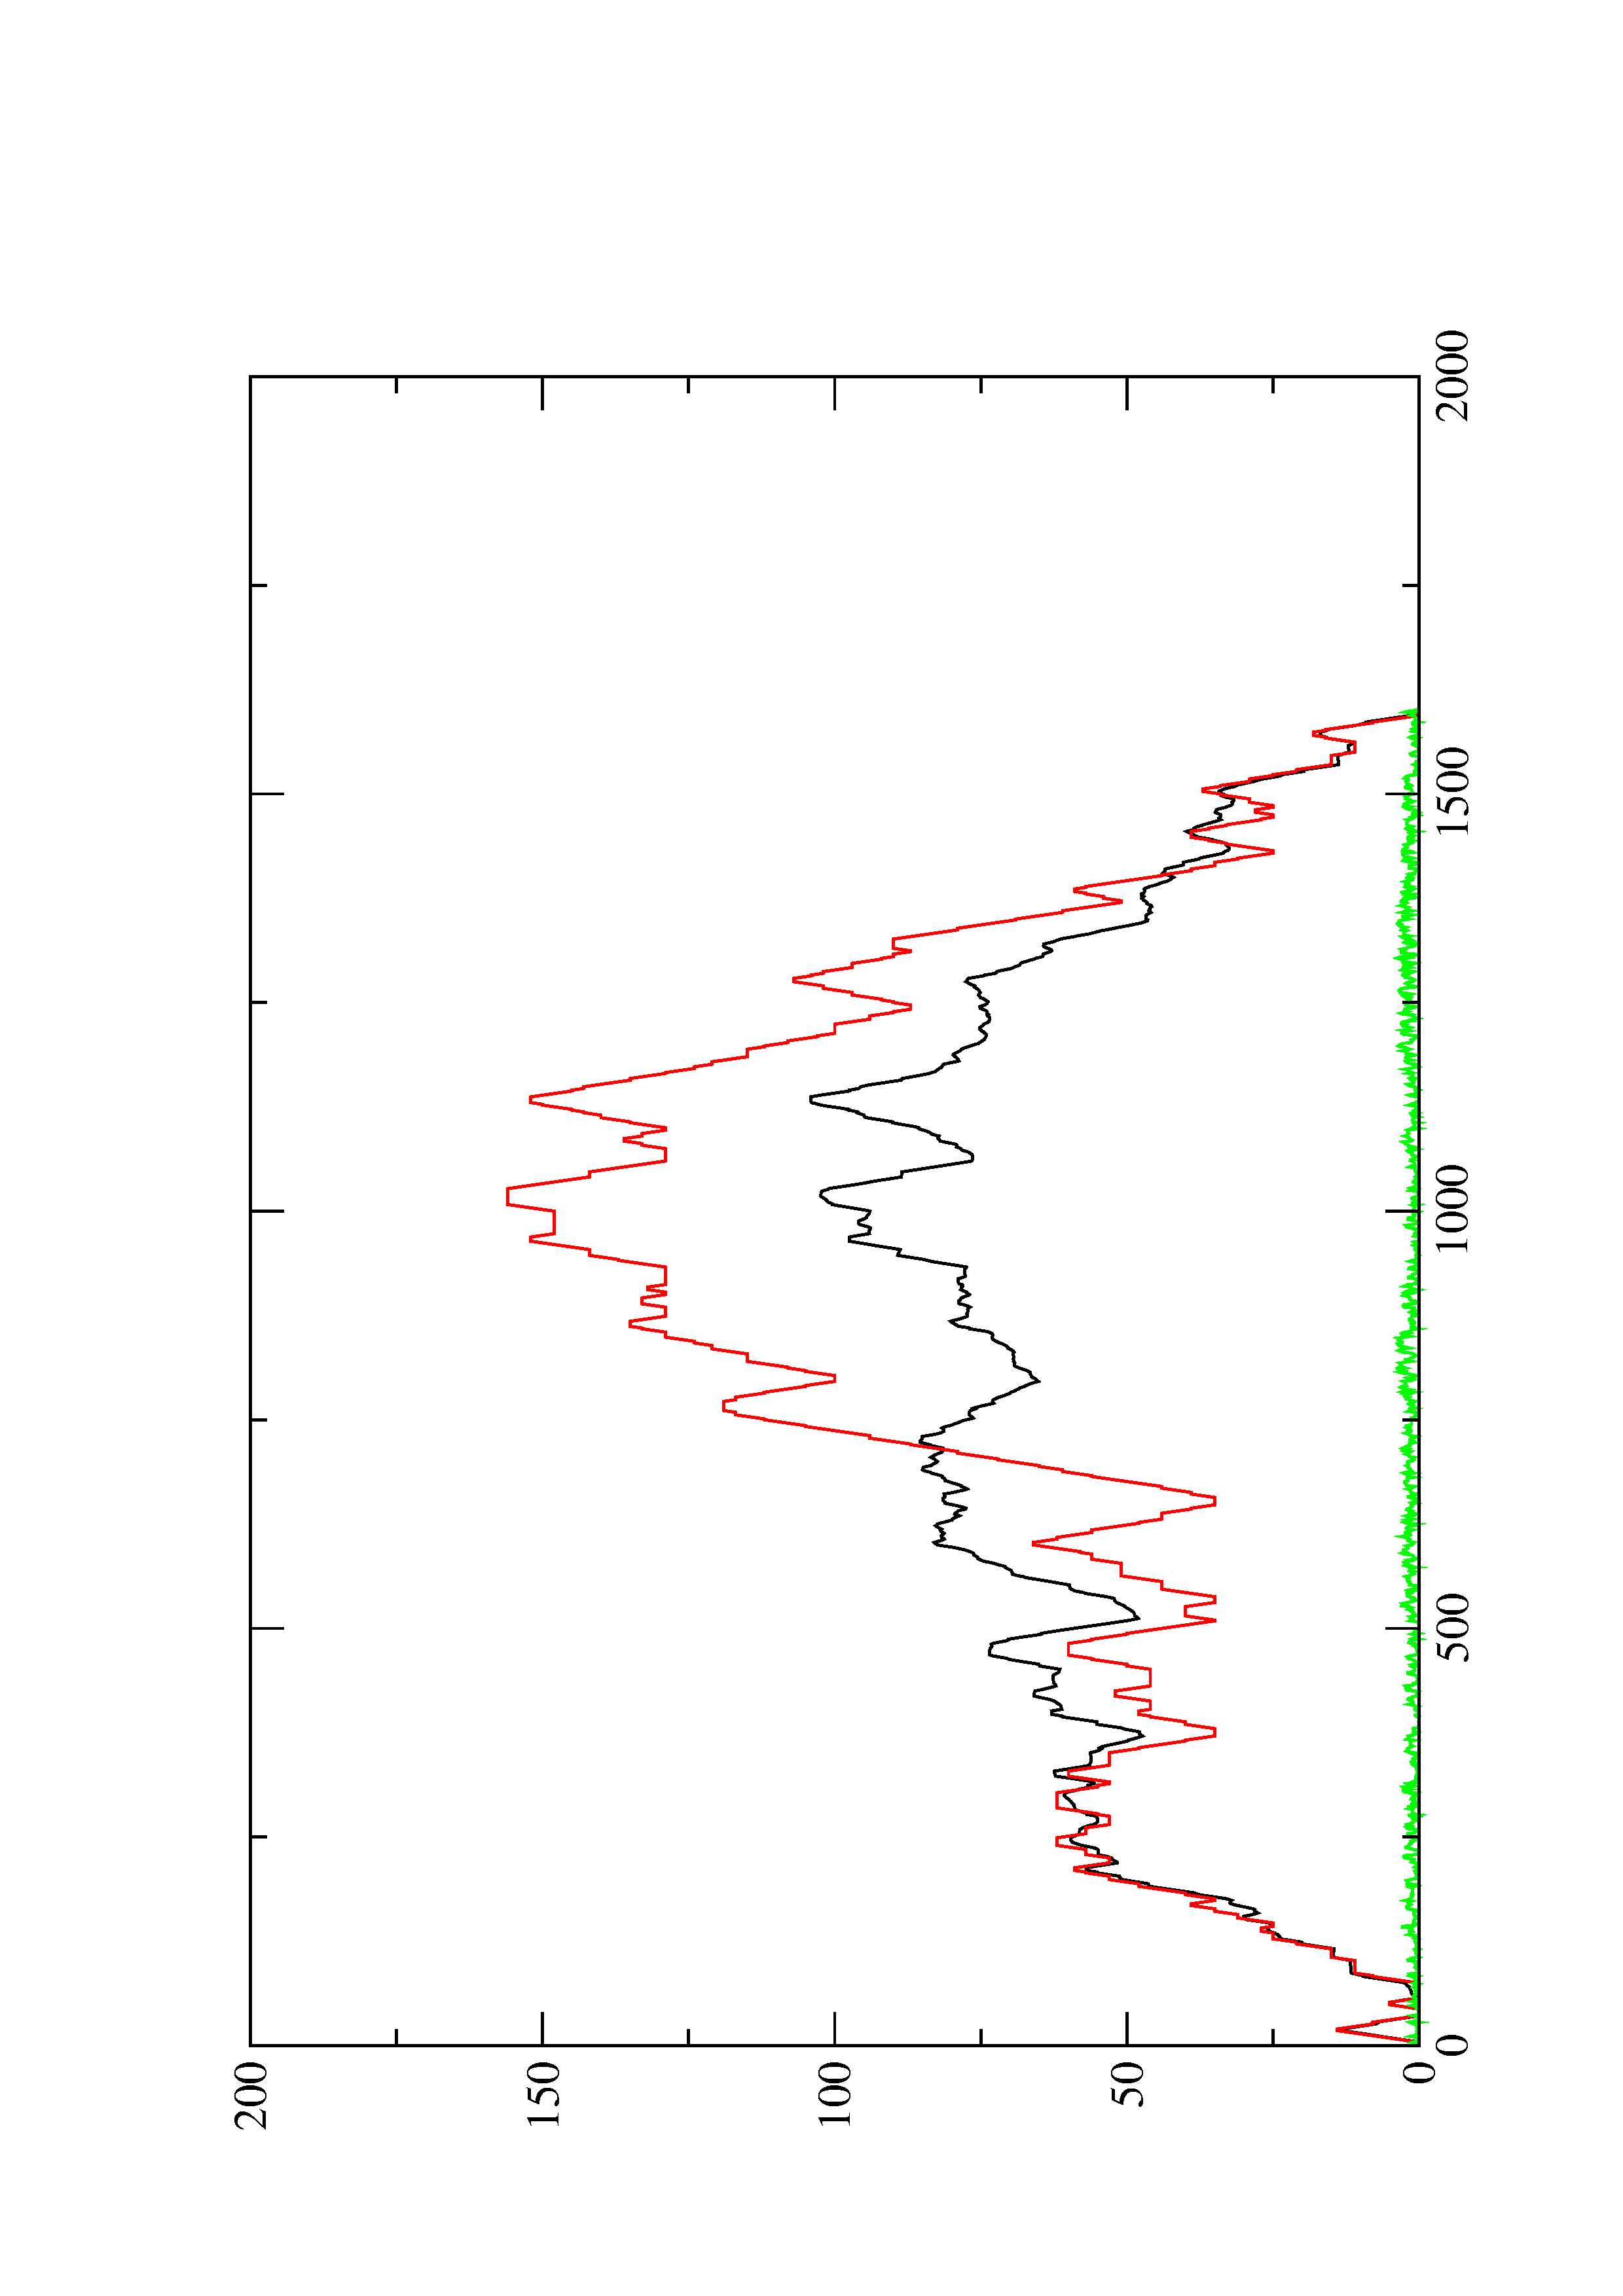
2. Here you find a mountain plot representation of the MFE structure, the thermodynamic ensemble of RNA structures, and the centroid structure. Additionally we present the positional entropy for each position. The resulting plot shows three curves, two mountain plots derived from the MFE structure (red) and the pairing probabilities (black) and a positional entropy curve (green). Well-defined regions are identified by low entropy.