lncRNA Structure Prediction
Species Name : Withania somnifera Sequence Id : GBHJ01042622.1
I. Result for minimum free energy prediction
The optimal secondary structure in dot-bracket notation with a minimum free energy of (-316.80) is given below.
1. Sequence-
GGGGGGGGGGUGUGCAGGAAAGCCACGUGUUUAGGGCAAACGUAAAAUAGUGAAGACACC
UGAUGGGCCCCUUGAUAAAGCAGGGUAAUCCAGGGGAAUUGGGUGUCCUCAUUGGUUGUG
CAGGUAUUAACCAAUGAAAAAGUGGACACGUAAAUAGCACUAGACCAAAAAAAGGUGACA
CGUAUGUACCUUCAACAAAGUGGUGAAUGCUUUUAAGUGGGAGGUUGGACGCGUGUCUCC
UUACUGCUUUACACUUGCUCACCUUCUUUUUAUAGAGCGUGAGCAAAGGUUUGUGGUUAA
UUAAGGCGACGCGUCGCAAGUCUUGUCAAGUCAAAACACGAGAGAUAAAAUUAAAAGACA
CAAAAAAAGAAUAACAUGAUUCUUGCGCAAAGAAGGACACGUAUAAAGGAUAAAUAGUAC
UACAUCUACACUAAUUACAAAAUAUUAGCAGUGGUACUCAUAUAAUUAUUGGGUGCUUAU
CUUCUUUAAAGAUAGGAAAACACAAUCAAGUAGAUUUUGAUAAGAUUCUCUCGAGAUAGG
AAAUGUUAGGAGUAGGAGUAUAGUUUCUUUGUUUUCCUUUUAGUAUCAUUUUCAAUGGUU
GCUUGUAUAUAGGAAAGACAUAGUGUGACAACUAUAUAGAUUUCCCAUAAGAUUUUAUUU
CCUAAUUAUUAAUCUUUUUCUUCAUAUUUUAAAGUUGUUAAGAUAAUGGGUGAUAUAGUG
UGGCAAGUUGAAACUCAUCUACCUACGUCAGCCGAUGCUUUGCCUAAAGGGAAAAAGAUA
UGGUAUAUUAGAAAAGUAUUACCCUAACCCAAAUUUCCGCUAAAGAUGAUAUGUAAAAAA
UAAUUCAUACUUAUAUUUCAGAAAAGAAUGUUCUAUCAUAAAUGGACUUCCUUUACAGUA
CAUAGCAAGUAUAUAUUACACCAAAAAGGGAAGUAAUAUACUUCAUAAUAACCUGUUUGC
AAUACAUUAACAAGAAAAUAGUAUGAAGAGAUUGAUCUUUAAACCUAACUAUGUAGUCAU
CAUGGGCAAAGUUGGAAAGGUGUAGUGGAAAGGGAAAAAAAAAAAGAAAAGGCCCAAGAG
UUUUGGUAAUAUAUUCAACCAAAGGUAUCCUCAAAGCUAAUACAUGUAAUGAUUAAAAUU
UAACCUUCUUCAAAGCUACUUUUUGUUGUUCCUUUAAUUUCUCAGUUUAUUUUCUUAUUC
AUAUUUCAUUGUGACAAUUCAUUUAUUAAUAAUCAAAUCAACUGAUGGAACUUAAGCCAU
UCUCUAAAUUUGGAAAUUCCAACGUCUAAAUGAAAAGUUAGCAUGCAUAUACUAAAAUAC
AUUCACAAUGCCAUUUCGUUGUCCCCUUCUUUACUCAUGAAUAUUUAUUGCGUCCAAUAU
UUGCAAUAAUUGCACUUUCCUUCGUUUAAGUUUAUGUAGUGGUAUGAUUGACCCAUCAUA
AUCGAAUUUAAAAAAAAAAAAA
2. MFE structure-
.((((((((((((.((((...(((.(((...((((....((........)).......))))))))))..))))......((((((((...((((((.(((.((((((((((((((((.........))))))))))......)))))).)))..................((((((.((....))))))))((((.(((
(((((((((..(((.(((((((.((((((((((((((.(((((((((...((..((((((((.((((......)))).))))))))..))..))))).....)))).)))))).))....((((((...........))))))....((((((((.((((((((((((((((......))))))((...(((((((....
...............((((((((..(((.................)))..))))))))....(((((((((.(((((((((((.....))))))))........((((((.....))))))...(((((.((((((((((((((....((..((((.(((...(((((...((((((((((((...((....((.(((((
(..((((..((((..((.((...(((.(((.((((((......(((((((((((................))))))........((((((((.....)))))))))))))..))))))))).)))...))...))..))))..)))).)))))).))...)).))))))))))))..............))))).....)
))))))..))..))))))....(((((((..(((.....)))..)))).))).)))))).))..)))))((((..........))))((((((..((.(((((.....(((.....))).((.....))((((((...))))))........((((((.................))))))..((((((......)))))
)...((((((.(((...........))).))))))....))))).))..))))))...............(((....((((((((((..........))))))).....)))...)))....))).)))))))))........)))))))....))...)))))).))))..))))))))..(((((.((((..((((((
(((......)))))..............))))..)))).)))))((((........))))..((((....))))...)))))).))).........((......))...)))).)))..))))).....))))))).))))))))))...)))))).)).....((((((((.........))))))))..)))))))))
))).(((((((((.(((.((((..........)))).)))...)))))))))..........
You can download the minimum free energy (MFE) structure in
II. Results for thermodynamic ensemble prediction
1. The free energy of the thermodynamic ensemble is [-347.93] kcal/mol.
2. The frequency of mfe structure in ensemble 1.15442e-22.
3. The ensemble diversity 402.35.
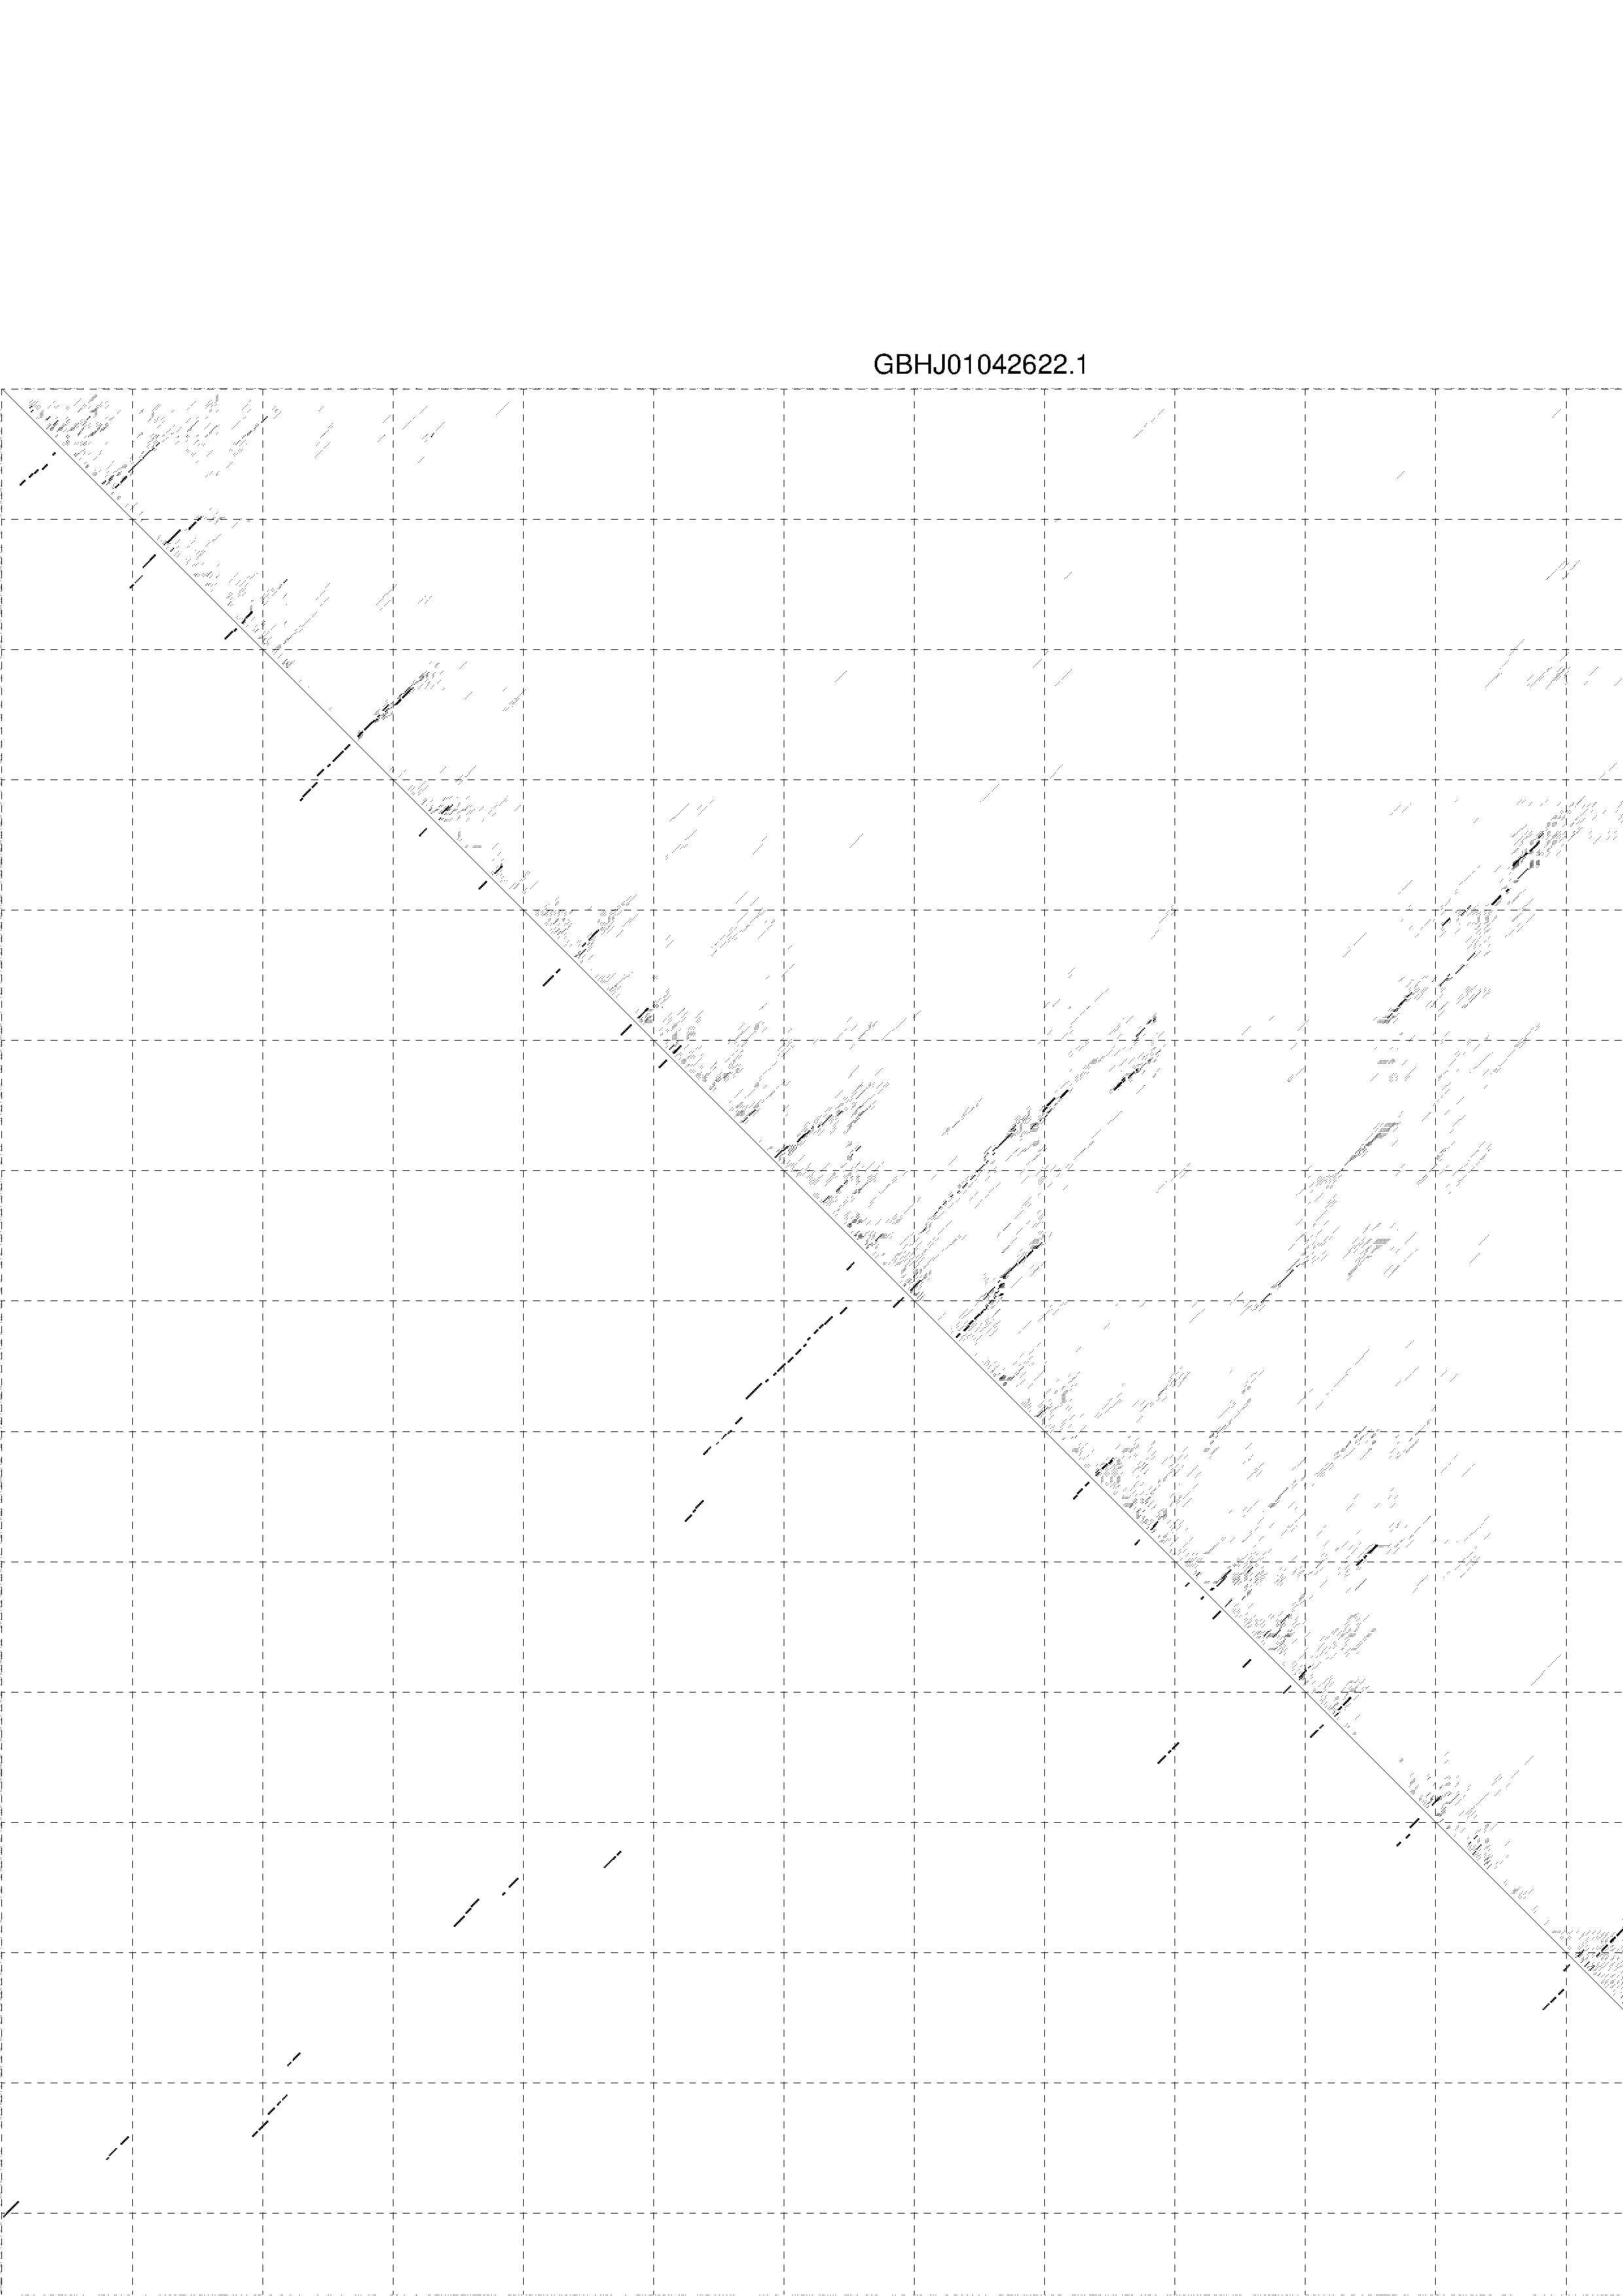
4. You may look at the dot plot containing the base pair probabilities [below]
III. Graphical output
1. A note on base-pairing probabilities:--
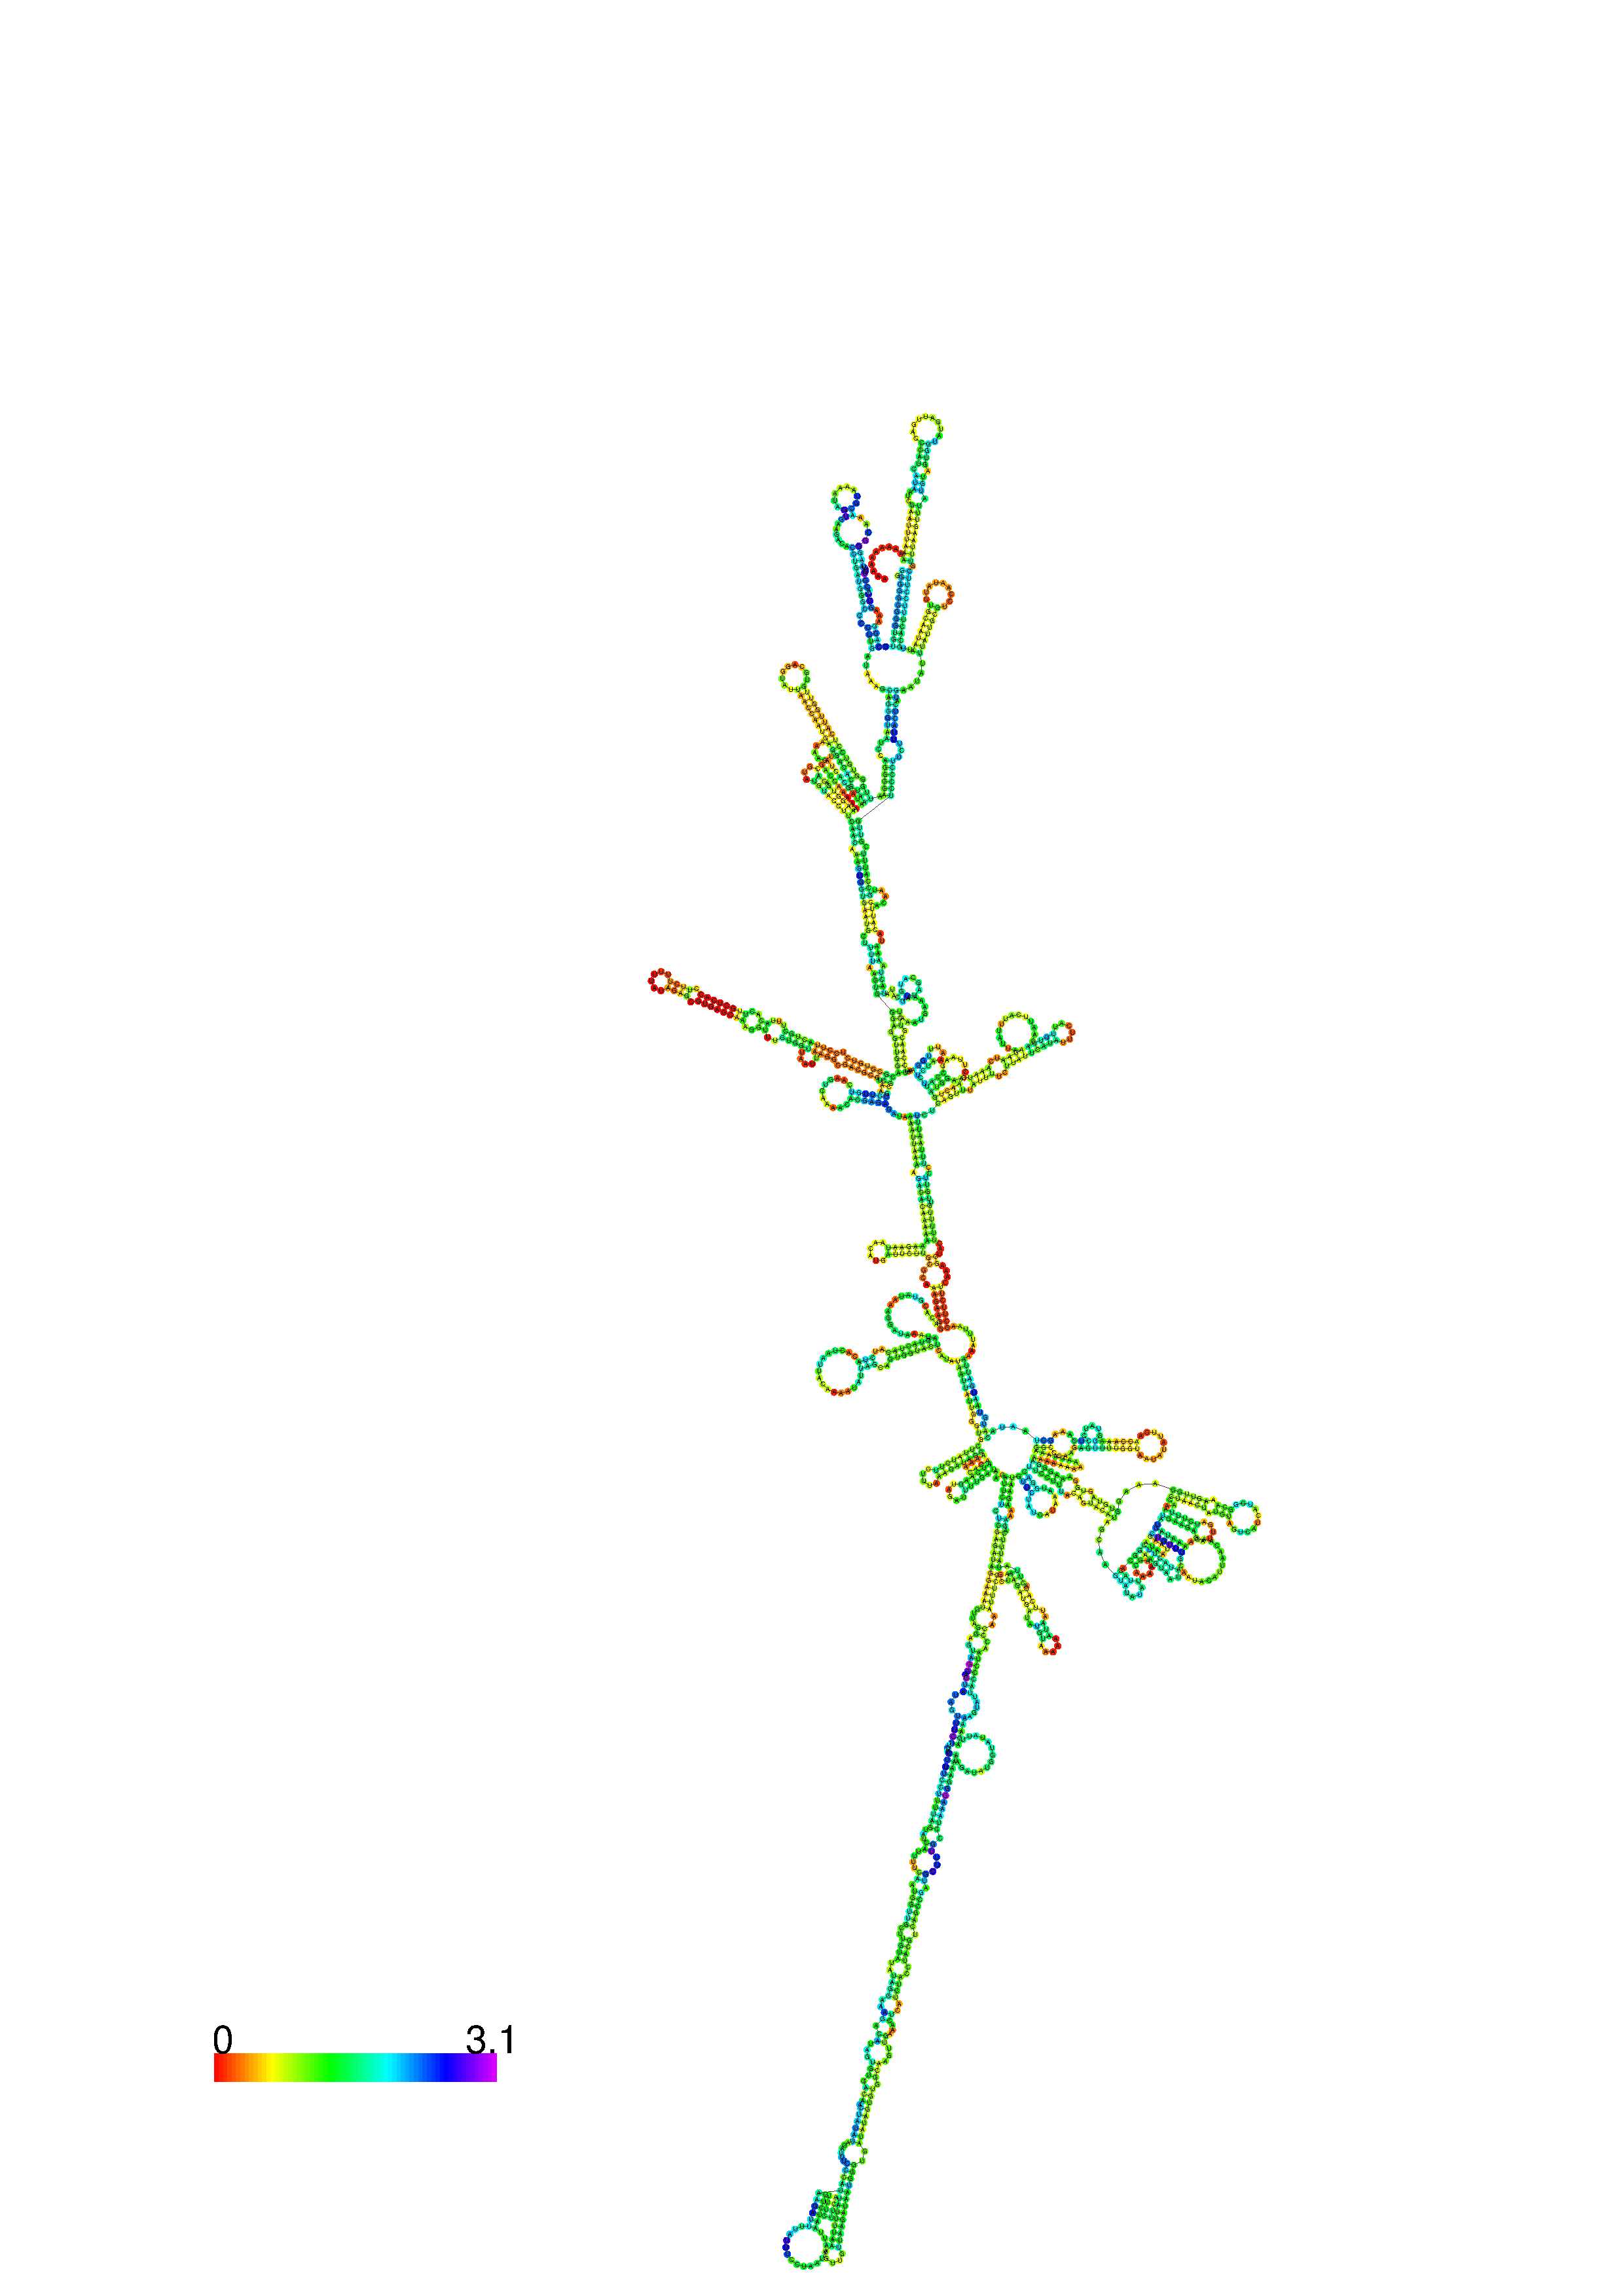
The structure below is colored by base-pairing probabilities. For unpaired regions the color denotes the probability of being unpaired. The reliability information of RNA secondary structure
plot in the form of color annotation, Positional entropy ranging from red (low entropy, well-defined) via green to blue and
violet (high entropy, ill-defined).
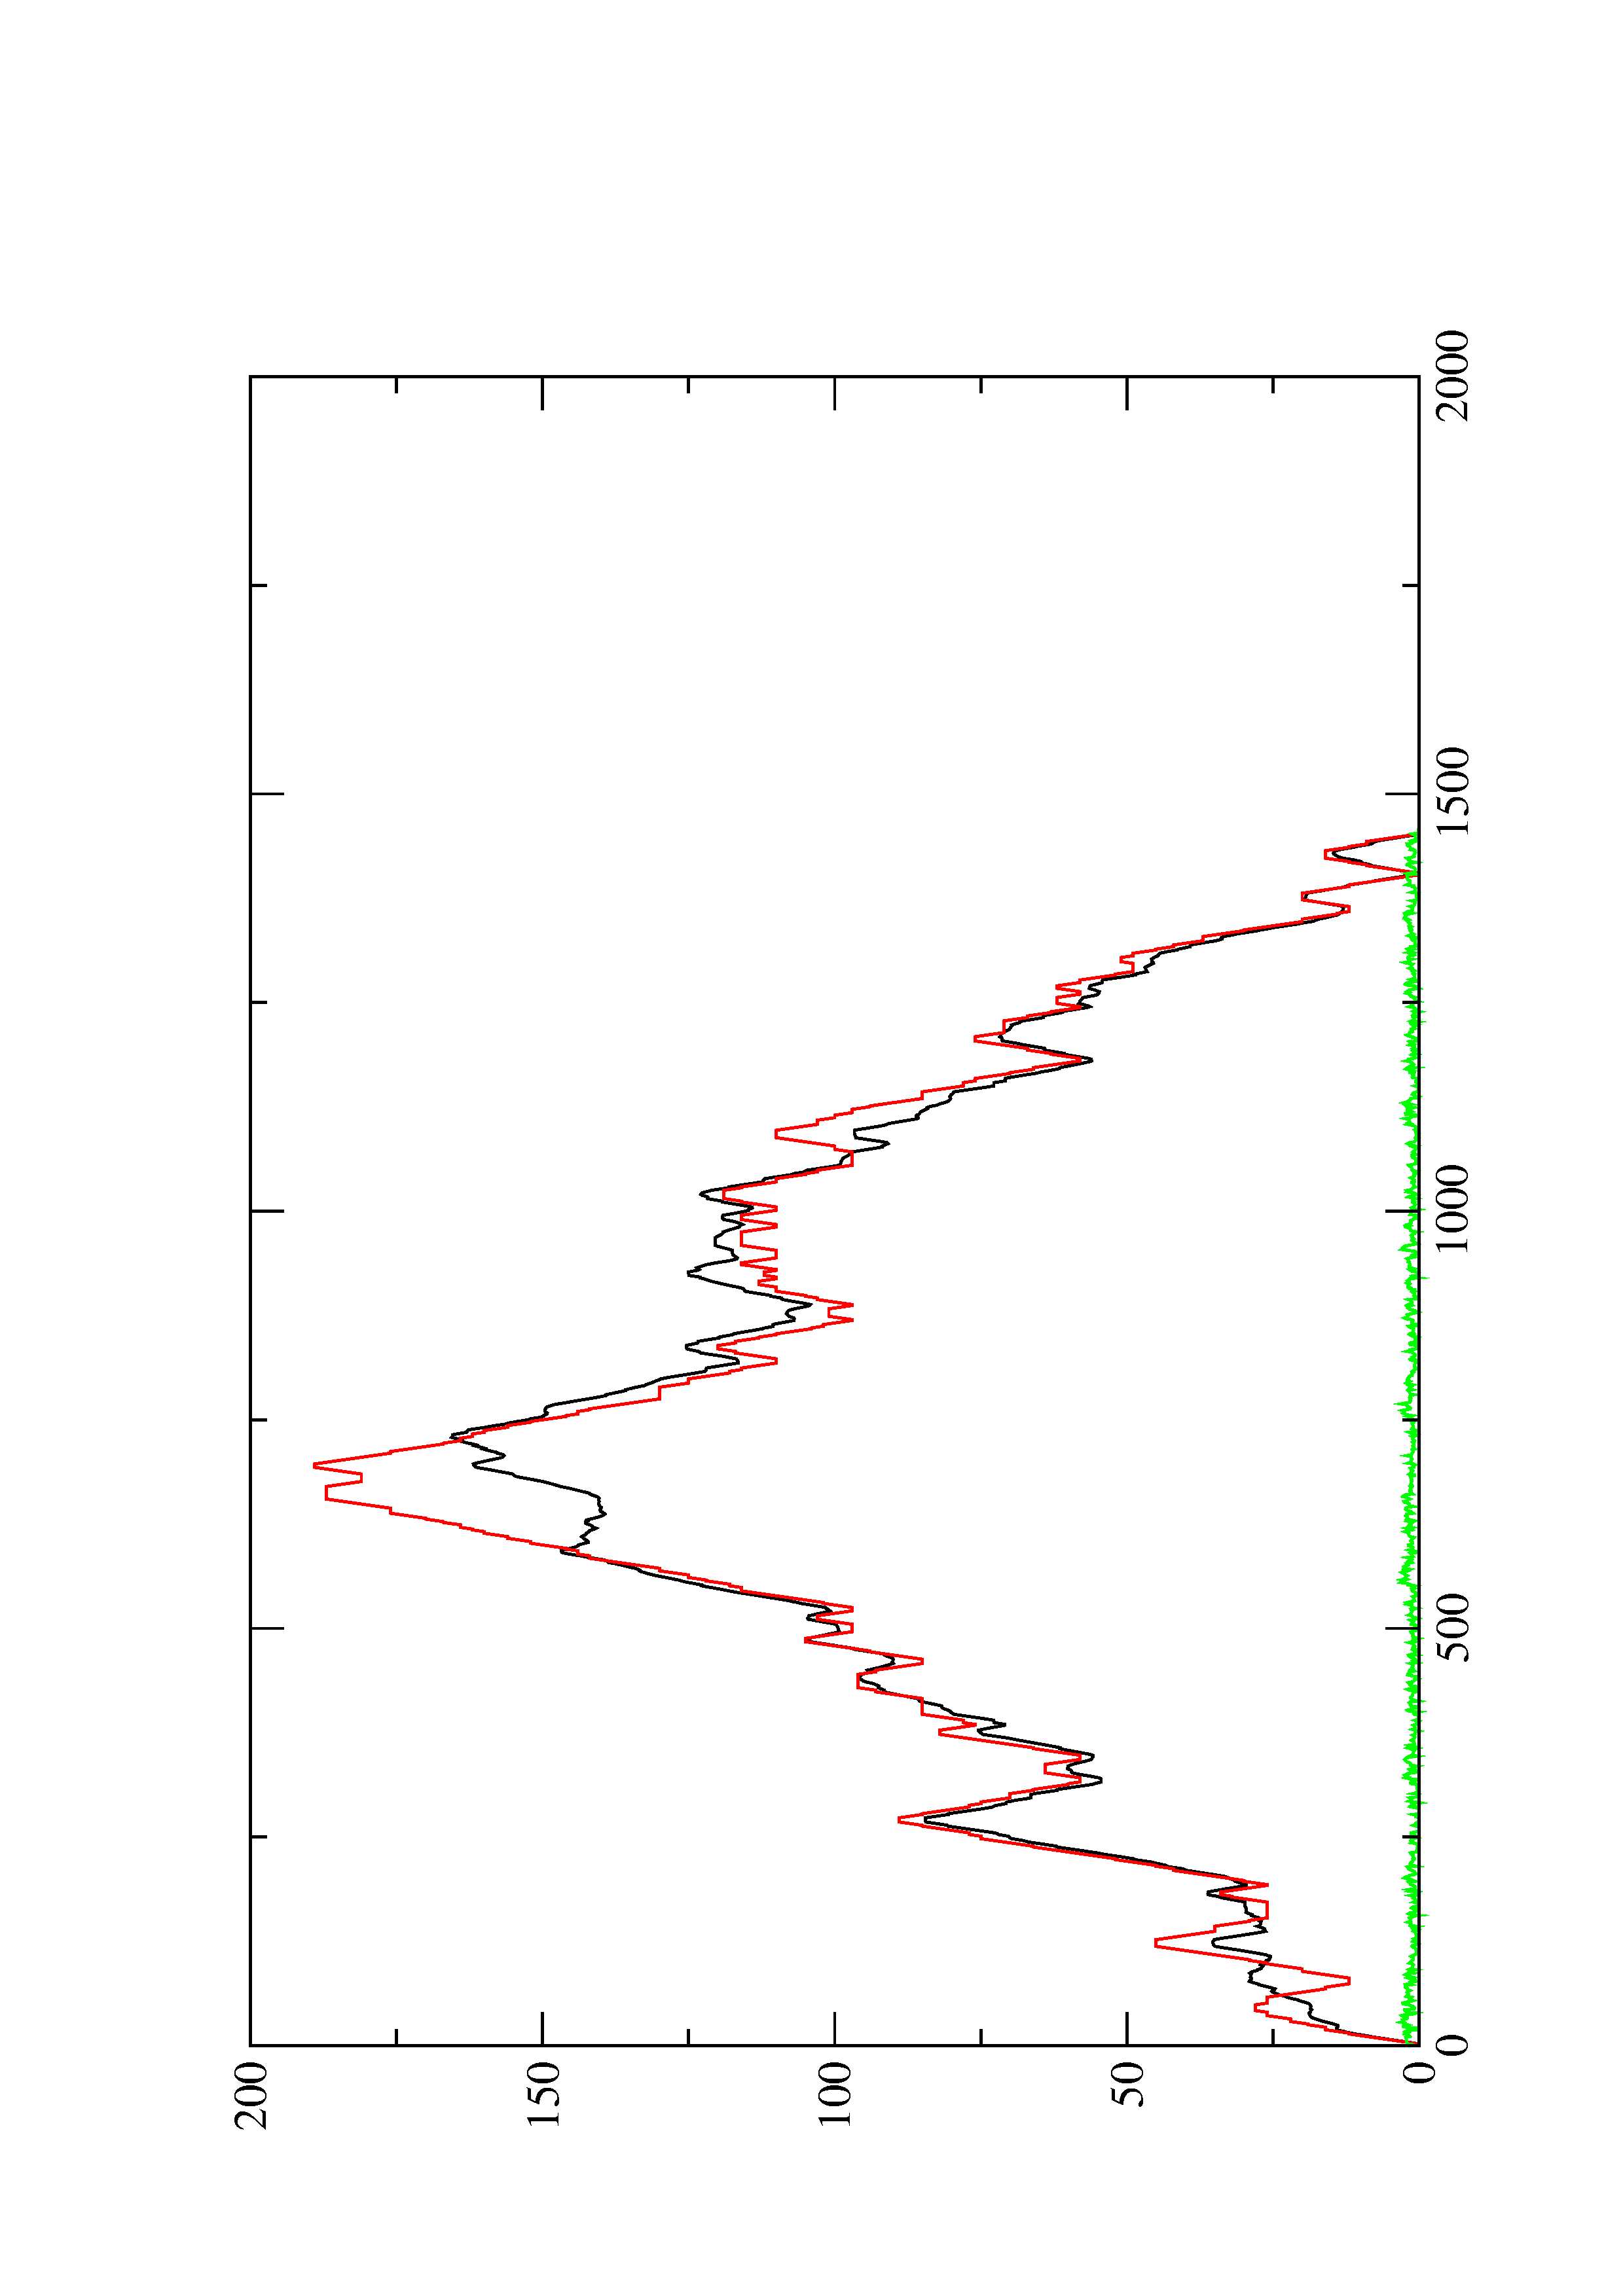
2. Here you find a mountain plot representation of the MFE structure, the thermodynamic ensemble of RNA structures, and the centroid structure. Additionally we present the positional entropy for each position. The resulting plot shows three curves, two mountain plots derived from the MFE structure (red) and the pairing probabilities (black) and a positional entropy curve (green). Well-defined regions are identified by low entropy.